HOT TOPICS LIST
- MACD
- Fibonacci
- RSI
- Gann
- ADXR
- Stochastics
- Volume
- Triangles
- Futures
- Cycles
- Volatility
- ZIGZAG
- MESA
- Retracement
- Aroon
INDICATORS LIST
LIST OF TOPICS
PRINT THIS ARTICLE
by Ron Walker
The recent runup in the stock market since the March lows still has the bulls giddy. But their bearish cohorts can make a pretty persuasive argument for a summer selloff in the stock market. Over the past couple of months, the S&P 500 has been busy chiseling out a top-reversal pattern while the VIX has been quietly waiting in the wings, positioning itself for a breakout.
Position: N/A
Ron Walker
Ron Walker is an active trader and technical analyst. He operates an educational website dedicated to the study of Technical Analysis. The website offers free market analysis with daily video presentations and written commentaries. Ron is a video pioneer, being one of the first to utilize the internet producing Technical Analysis videos. His website is thechartpatterntrader.com
PRINT THIS ARTICLE
VOLATILITY
Don't Underestimate The Power Of The VIX
07/21/09 12:03:38 PMby Ron Walker
The recent runup in the stock market since the March lows still has the bulls giddy. But their bearish cohorts can make a pretty persuasive argument for a summer selloff in the stock market. Over the past couple of months, the S&P 500 has been busy chiseling out a top-reversal pattern while the VIX has been quietly waiting in the wings, positioning itself for a breakout.
Position: N/A
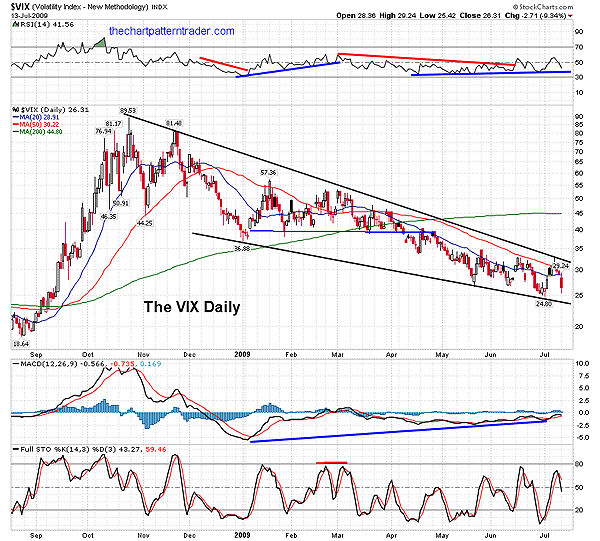
| The volatility index (VIX) is a contrarian indicator. It moves in the opposite direction of the overall market. It is used by traders to help spot places of capitulation and complacency, offering clues of market volatility and sentiment. When the VIX is moving higher, the stock market is likely to be declining. In contrast, when the VIX is moving lower, the stock market should be rising. The indicator gives its best signals when it reaches extremes. When VIX climbs steadily higher it exposes weakness in the market by pressing and pushing prices lower, as investors vacate the premises. Currently, there are many bullish hopefuls betting that the stock market has concluded its corrective move in a sideways correction. But chart watchers have been eyeing the VIX's nine-month bullish falling wedge with extreme interest (Figure 1). The pattern has been forming ever since the VIX peaked at 89.53 back in October 20, 2008. |

|
| FIGURE 1: $VIX, DAILY. The VIX daily chart has set up a bullish divergence with the MACD, but the bearish crossover on the stochastic shows that short-term momentum has postponed the breakout of the pattern. The relative strength index (RSI) has also formed a bullish divergence. |
| Graphic provided by: StockCharts.com. |
| |
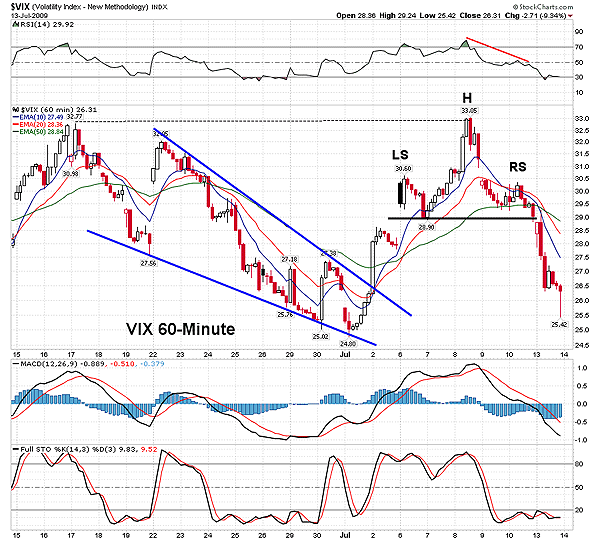
| Figure 1 shows that on July 1, 2009, the VIX bottomed out at 24.80, bouncing off the lower boundary of the wedge pattern before turning and making its way back up to test the trend. On July 8, the VIX attempted to break above the long-term trendline but was unsuccessful. The VIX quickly retreated from the trendline and sank back into the falling wedge pattern by the end of day. The VIX has now pulled back to test the July 1st low at 24.80. What happened? Why didn't the VIX break out? By studying the VIX's 60-minute chart in Figure 2, we can see what went wrong. Here we see that the VIX formed a short-term, bullish falling wedge in late June. The pattern attempted to break out in early July as price snapped back to prior resistance near 33. Then the VIX skid back to support at the 50-period exponential moving average (EMA), trying to gain traction. The bounce produced a lower high and completed the right shoulder of the head & shoulders top. In the following session, the pattern broke down from the H&S top. So should we now write off the bullish wedge pattern on the daily chart? Not at all! Often, prices will attempt to blast off out of a reversal pattern, only to find the launch temporarily postponed in order to find the perfect timing and conditions so that the breakout can thrive. |

|
| FIGURE 2: $VIX, HOURLY. The recent attempt made to break out on the daily chart failed as a head & shoulders reversal pattern set up on its 60-minute chart. Once the MACD turns bullish again here on the hourly chart, the VIX will likely make another stab at a breakout. |
| Graphic provided by: StockCharts.com. |
| |
| Recently, NASA had to delay the launch of the space shuttle Endeavour five times due to technical issues and unfavorable weather conditions. The conditions just weren't quite right for the space shuttle to have a successful liftoff and the mission had to be temporarily scrubbed. But sooner or later, the technical problems will be corrected, the unfavorable conditions will go away, and the Endeavour will blast off on its way to fulfill its mission at the space station. The same is true for the VIX. The bearish head & shoulders pattern on the 60-minute chart has delayed the breakout on the daily chart. But eventually the technical issues on the hourly chart will be repaired and corrected and the unfavorable conditions will disappear, as the bullish falling wedge on the daily chart ultimately rockets higher. Very soon the hourly, daily, and weekly chart of the VIX will begin to move in sync in a coordinated effort to drive down the stock market. |

|
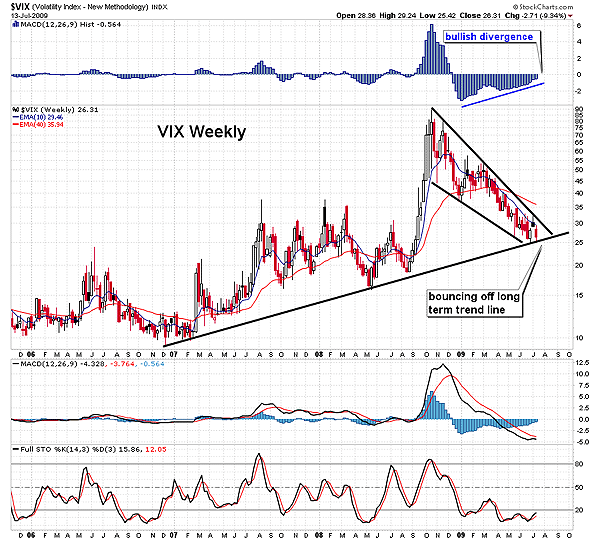
| FIGURE 3: $VIX, WEEKLY. The weekly chart shows the VIX testing long-term support with a bullish divergence on the MACD histogram. The bullish MACD histogram should ignite the VIX. Once that occurs, the MACD should turn bullish as the stochastic moves out of oversold territory. |
| Graphic provided by: StockCharts.com. |
| |
| The weekly chart in Figure 3 shows yet another bullish scenario looming over the VIX. Note the falling wedge pattern that we looked at on the daily chart has come to rest on the primary trendline from late 2006, where there is a groundswell of support. The moving average convergence/divergence (MACD) histogram (12,26, 9) has formed a bullish divergence, as the MACD has flattened out and moved closer to its trigger line. The stochastic (14, 3, 3) has been inching up toward the 20 level. All three indicators suggest that the VIX will likely do a 180, while the prospects look dim for the stock market. This ticking time bomb will likely explode after the current rally in the stock market has concluded. The VIX is ready to explode higher, while the bears are preparing to oust the bulls and regain lost ground. |

|
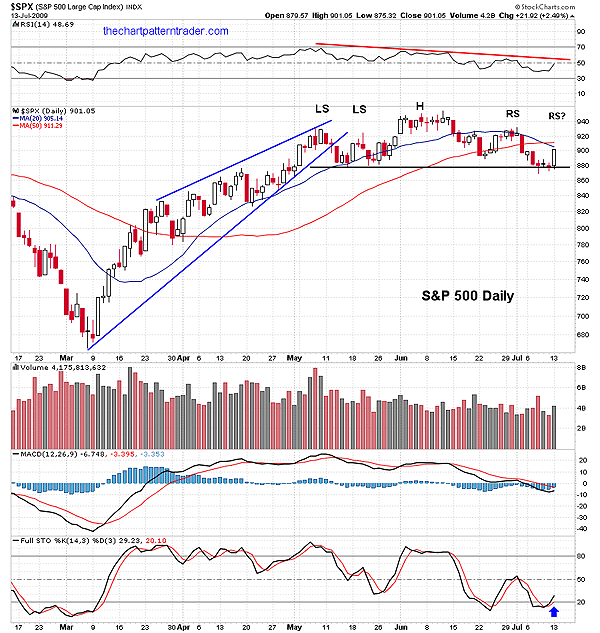
| FIGURE 4: S&P 500, DAILY. The VIX has pulled back in order to build some momentum; meanwhile, the S&P 500 is busy setting up the second right shoulder in a head & shoulders top pattern. Once the shoulder is completed, the VIX gains traction. If the S&P 500 closes below the confirmation line of the pattern at 879, the VIX is likely to break out of its falling wedge pattern. |
| Graphic provided by: StockCharts.com. |
| |
| Figure 4 shows that the Standard & Poor's 500 has been carving out a complex head & shoulders pattern on the daily chart, looking ripe for a reversal. Once the second right shoulder has concluded, the odds favor that VIX turns to take another shot at breaking out of the falling wedge. Apparently, its delay occurred so that the S&P 500 could finish grinding through a top-reversal pattern. Don't underestimate the dynamic power of the VIX. Its contrarian predictive powers suggest that the bears will make a roaring come back during the summer, in a flagrant act of disobedience against the bulls. |
Ron Walker is an active trader and technical analyst. He operates an educational website dedicated to the study of Technical Analysis. The website offers free market analysis with daily video presentations and written commentaries. Ron is a video pioneer, being one of the first to utilize the internet producing Technical Analysis videos. His website is thechartpatterntrader.com
| Website: | thechartpatterntrader.com |
| E-mail address: | thechartpatterntrader@gmail.com |
Click here for more information about our publications!
Comments
Date: 07/22/09Rank: 5Comment:

Request Information From Our Sponsors
- VectorVest, Inc.
- Executive Premier Workshop
- One-Day Options Course
- OptionsPro
- Retirement Income Workshop
- Sure-Fire Trading Systems (VectorVest, Inc.)
- Trading as a Business Workshop
- VectorVest 7 EOD
- VectorVest 7 RealTime/IntraDay
- VectorVest AutoTester
- VectorVest Educational Services
- VectorVest OnLine
- VectorVest Options Analyzer
- VectorVest ProGraphics v6.0
- VectorVest ProTrader 7
- VectorVest RealTime Derby Tool
- VectorVest Simulator
- VectorVest Variator
- VectorVest Watchdog
- StockCharts.com, Inc.
- Candle Patterns
- Candlestick Charting Explained
- Intermarket Technical Analysis
- John Murphy on Chart Analysis
- John Murphy's Chart Pattern Recognition
- John Murphy's Market Message
- MurphyExplainsMarketAnalysis-Intermarket Analysis
- MurphyExplainsMarketAnalysis-Visual Analysis
- StockCharts.com
- Technical Analysis of the Financial Markets
- The Visual Investor
