HOT TOPICS LIST
- MACD
- Fibonacci
- RSI
- Gann
- ADXR
- Stochastics
- Volume
- Triangles
- Futures
- Cycles
- Volatility
- ZIGZAG
- MESA
- Retracement
- Aroon
INDICATORS LIST
LIST OF TOPICS
PRINT THIS ARTICLE
by Chaitali Mohile
Oshkosh Corp is in a stable uptrend and in a bullish environment. The gap up breakout rally has recently hit a resistance level.
Position: N/A
Chaitali Mohile
Active trader in the Indian stock markets since 2003 and a full-time writer. Trading is largely based upon technical analysis.
PRINT THIS ARTICLE
GAPS
Oshkosh Corp-Gap Up
07/14/09 10:58:51 AMby Chaitali Mohile
Oshkosh Corp is in a stable uptrend and in a bullish environment. The gap up breakout rally has recently hit a resistance level.
Position: N/A
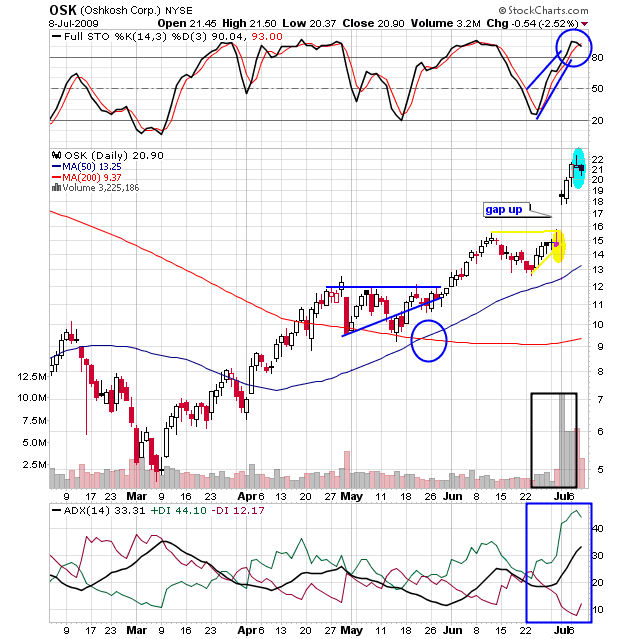
| Oshkosh Corp. (OSK) has steadily climbed to higher levels in a relatively short period of time. A bullish flag & pennant breached upwards and resumed the prior advance rally. Along with the price breakout, the moving averages (MA) witnessed a bullish crossover as well. After the breakout, the 50-day MA surged vertically, providing support to price movement. OSK consolidated at every essential level. On the daily chart in Figure 1, OSK went sideways in May and June. During the sideways rally in June, a shooting star was formed, indicating a bearish breakout of the consolidation range (see the candlestick in yellow block). But following a single candlestick pattern in isolation might whipsaw the trade. |

|
| FIGURE 1: OSK, DAILY. The bearish candles and an overbought stochastic is likely to refill the gap. |
| Graphic provided by: StockCharts.com. |
| |
| The full stochastic (14,3,3) had surged into a bullish area above the 50 level and the average directional index (ADX) (14) is indicating a developing uptrend. In such conditions a single bearish reversal candlestick pattern cannot twist the rally, and hence, can be ignored. The gap up breakout strengthened the oscillators and breached an upper trading range on the price chart. After the gap up of approximately $2.5, OSK jumped to $18 and soon reached $22. The volumes surged dramatically; the ADX (14) reflected the developed uptrend in Figure 1. But the stochastic oscillator seems unsteady in an overbought zone. The descending stochastic might generate a minor corrective phase for OSK. The price chart shows the shooting star at the top followed by a bearish candle with a real body below the day's high (see the blue block) in Figure 1. Therefore, the downside rally is reconfirmed by the two candlesticks. |
| Since, the ADX (14) signifies a firm uptrend, the future bearish rally might stabilize at the nearest support around $18. In addition, the correction in stochastic (14,3,3) would create room for a future bullish rally. I would recommend profit booking at the current level, and reenter longs near the support. Most gaps are filled sooner or later; therefore, the anticipated bearish rally might plunge to an earlier support of $15. |

|
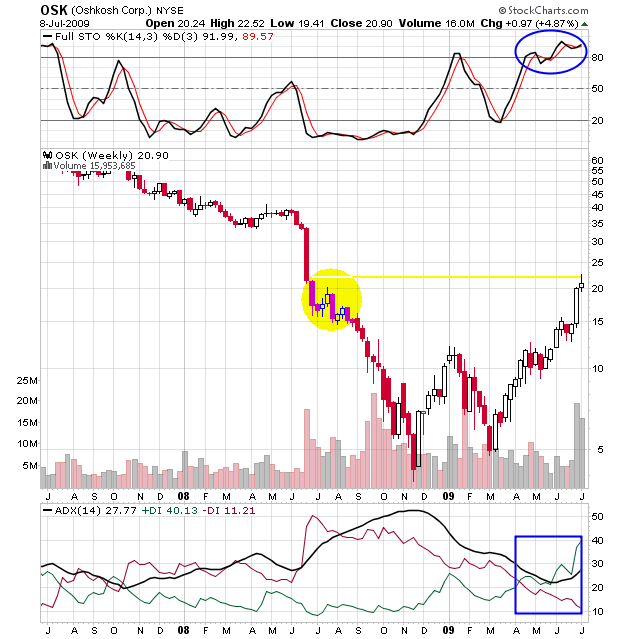
| FIGURE 2: OSK, WEEKLY. The stock has hit the previous high resistance. |
| Graphic provided by: StockCharts.com. |
| |
| The weekly chart in Figure 2, shows a previous high resistance at $22. The stochastic (14,3,3) is zigzagging in an overbought area, indicating the possibility of volatile price action near the resistance. However, the uptrend is healthy. So, OSK is likely to retrace back to the previous support due to volatility. In addition, the current uncertainty in global markets would energize the bearish rally of OSK. |
| Therefore, I recommend profit booking. Once the stock establishes support on healthy bullish notes, traders can re-enter the trade as the long-term uptrend is likely to sustain. |
Active trader in the Indian stock markets since 2003 and a full-time writer. Trading is largely based upon technical analysis.
| Company: | Independent |
| Address: | C1/3 Parth Indraprasth Towers. Vastrapur |
| Ahmedabad, Guj 380015 | |
| E-mail address: | chaitalimohile@yahoo.co.in |
Traders' Resource Links | |
| Independent has not added any product or service information to TRADERS' RESOURCE. | |
Click here for more information about our publications!
PRINT THIS ARTICLE

Request Information From Our Sponsors
- VectorVest, Inc.
- Executive Premier Workshop
- One-Day Options Course
- OptionsPro
- Retirement Income Workshop
- Sure-Fire Trading Systems (VectorVest, Inc.)
- Trading as a Business Workshop
- VectorVest 7 EOD
- VectorVest 7 RealTime/IntraDay
- VectorVest AutoTester
- VectorVest Educational Services
- VectorVest OnLine
- VectorVest Options Analyzer
- VectorVest ProGraphics v6.0
- VectorVest ProTrader 7
- VectorVest RealTime Derby Tool
- VectorVest Simulator
- VectorVest Variator
- VectorVest Watchdog
- StockCharts.com, Inc.
- Candle Patterns
- Candlestick Charting Explained
- Intermarket Technical Analysis
- John Murphy on Chart Analysis
- John Murphy's Chart Pattern Recognition
- John Murphy's Market Message
- MurphyExplainsMarketAnalysis-Intermarket Analysis
- MurphyExplainsMarketAnalysis-Visual Analysis
- StockCharts.com
- Technical Analysis of the Financial Markets
- The Visual Investor
