

HOT TOPICS LIST
- MACD
- Fibonacci
- RSI
- Gann
- ADXR
- Stochastics
- Volume
- Triangles
- Futures
- Cycles
- Volatility
- ZIGZAG
- MESA
- Retracement
- Aroon
INDICATORS LIST
LIST OF TOPICS
PRINT THIS ARTICLE
by Mike Carr, CMT
In addition to providing buy and sell signals, RSI can highlight longer-term trends in the market.
Position: N/A
Mike Carr, CMT
Mike Carr, CMT, is a member of the Market Technicians Association, and editor of the MTA's newsletter, Technically Speaking. He is also the author of "Smarter Investing in Any Economy: The Definitive Guide to Relative Strength Investing," and "Conquering the Divide: How to Use Economic Indicators to Catch Stock Market Trends."
PRINT THIS ARTICLE
RSI
Spotting Trends with RSI
07/12/09 05:59:47 PMby Mike Carr, CMT
In addition to providing buy and sell signals, RSI can highlight longer-term trends in the market.
Position: N/A
| J. Welles Wilder introduced the Relative Strength Index (RSI) in his 1978 book, New Concepts in Technical Analysis. RSI is best known as an overbought/oversold indicator. When RSI falls below 30, the market is considered to be oversold and traders should prepare their buy orders to take advantage of an expected rebound in prices. In an overbought market, RSI rises above 70, and when it falls below this level, traders sell. |
| Andrew Cardwell has refined the indicator with the idea of RSI Range Rules. He observed that in uptrends, RSI will usually stay between values of 40 to 80 while in bear markets, the indicator will typically fall as low as 20 and stay below 60. |
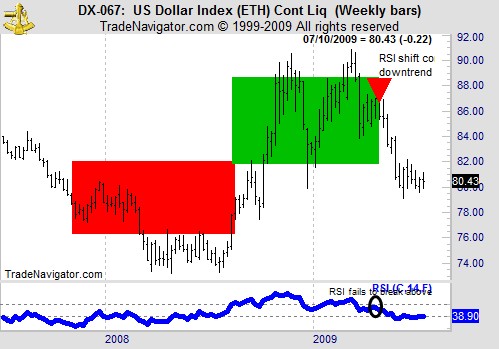
| Range Rules indicate the market trend in Figure 1, which shows a weekly chart of the US Dollar Index. While RSI moved between 20 and 60, the Dollar declined. A bull market in the Dollar was accompanied by a new range for RSI. |
|
| Figure 1: RSI levels can help traders identify the larger trend in the market. |
| Graphic provided by: Trade Navigator. |
| |
| In recent price action, RSI has crossed under 40 as prices have declined. The most recent peak in RSI was below 60, indicating the longer trend remains down. In this case, RSI gave a very timely signal that the trend had changed. The chart pattern indicates the Dollar may be bottoming, but cautious traders could wait for RSI to rise above 60 before taking a long position. |
Mike Carr, CMT, is a member of the Market Technicians Association, and editor of the MTA's newsletter, Technically Speaking. He is also the author of "Smarter Investing in Any Economy: The Definitive Guide to Relative Strength Investing," and "Conquering the Divide: How to Use Economic Indicators to Catch Stock Market Trends."
| Website: | www.moneynews.com/blogs/MichaelCarr/id-73 |
| E-mail address: | marketstrategist@gmail.com |
Click here for more information about our publications!
Comments
Date:�07/13/09Rank:�5Comment:�What is the RSI period and Avg period
Date:�07/14/09Rank:�4Comment:�
Date:�07/21/09Rank:�5Comment:�

Request Information From Our Sponsors
- VectorVest, Inc.
- Executive Premier Workshop
- One-Day Options Course
- OptionsPro
- Retirement Income Workshop
- Sure-Fire Trading Systems (VectorVest, Inc.)
- Trading as a Business Workshop
- VectorVest 7 EOD
- VectorVest 7 RealTime/IntraDay
- VectorVest AutoTester
- VectorVest Educational Services
- VectorVest OnLine
- VectorVest Options Analyzer
- VectorVest ProGraphics v6.0
- VectorVest ProTrader 7
- VectorVest RealTime Derby Tool
- VectorVest Simulator
- VectorVest Variator
- VectorVest Watchdog
- StockCharts.com, Inc.
- Candle Patterns
- Candlestick Charting Explained
- Intermarket Technical Analysis
- John Murphy on Chart Analysis
- John Murphy's Chart Pattern Recognition
- John Murphy's Market Message
- MurphyExplainsMarketAnalysis-Intermarket Analysis
- MurphyExplainsMarketAnalysis-Visual Analysis
- StockCharts.com
- Technical Analysis of the Financial Markets
- The Visual Investor