HOT TOPICS LIST
- MACD
- Fibonacci
- RSI
- Gann
- ADXR
- Stochastics
- Volume
- Triangles
- Futures
- Cycles
- Volatility
- ZIGZAG
- MESA
- Retracement
- Aroon
INDICATORS LIST
LIST OF TOPICS
PRINT THIS ARTICLE
by Chaitali Mohile
A healthy bullish rally initiated an intermediate uptrend for Dell Inc. After refilling a small gap down, the stock stands at a crucial support.
Position: Sell
Chaitali Mohile
Active trader in the Indian stock markets since 2003 and a full-time writer. Trading is largely based upon technical analysis.
PRINT THIS ARTICLE
CHANNEL LINES
Dell In New Direction
07/09/09 01:17:20 PMby Chaitali Mohile
A healthy bullish rally initiated an intermediate uptrend for Dell Inc. After refilling a small gap down, the stock stands at a crucial support.
Position: Sell
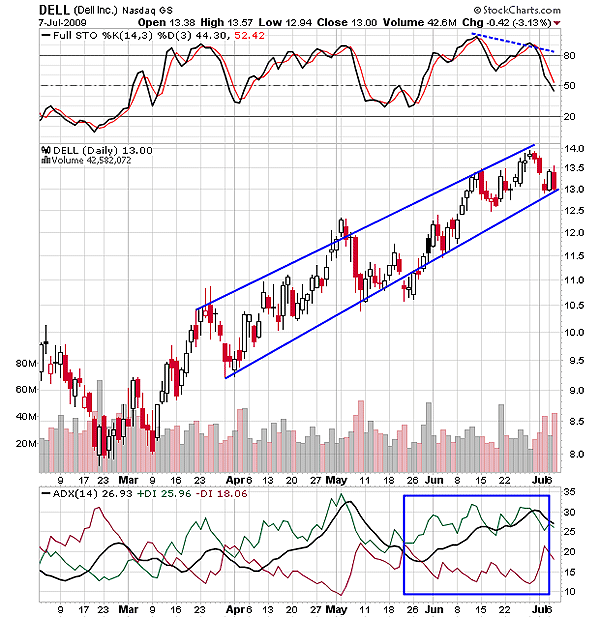
| Dell Inc. (DELL) began an intermediate uptrend with a new rally from $8. Earlier, the average directional movement index (ADX) (14) indicated a moderate bullish trend in Figure 1. The stock was pretty volatile till higher highs were formed. The shaky stochastic (14,3,3) might be the reason for the high price volatility. The three highs of DELL at $11, $12.50, and the recent $14 restricted the consistent price movement. We can see in Figure 1 that the stock dropped to support after every high, forming higher lows. Therefore, an upward or an ascending channel can be drawn connecting the higher highs and higher lows. The channel pattern can be considered as a road map for our trading. The upper and lower trendlines would highlight the support and resistance. DELL has correctly moved within the range of the two trendlines. |

|
| FIGURE 1: DELL, DAILY. The stock would initiate a major breakdown if the lower trendline of an ascending channel were violated. |
| Graphic provided by: StockCharts.com. |
| |
| Trading within the channel is always a safe trading strategy because traders can identify cut-off levels. In the past three days, DELL has established support at the lower trendline. The stochastic (14,3,3) has marginally slipped below the 50 level, indicating the possible downside on the price chart. The ADX (14) is indicating the developing uptrend at the current level (26 level), but the trend might weaken if the indicator slips down further. Therefore, the breakdown of the indicators would result in a downside breakout of the channel as well. Traders may want to stay neutral until the confirmed signs on either side are reflected in Figure 1. Currently, the stock is resting at the decision-making level. |
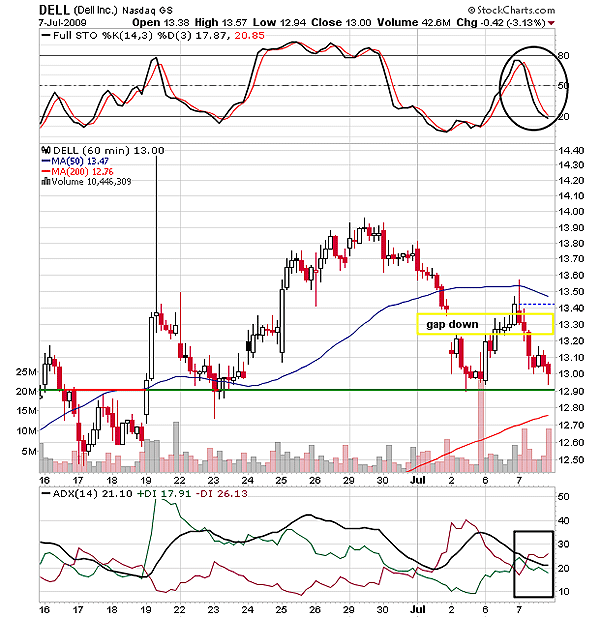
| Similarly, on the hourly chart in Figure 2, DELL has plunged to the support of $12.90. However, the level was frequently challenged after the breakout. A short-term round-top formation breached the 50-day MA support and initiated a new downtrend on an intraday chart in Figure 2. The bearish rally established the support at $12.90, and therefore, the levels hold robust strength to make or break the rally. |

|
| FIGURE 2: DELL, HOURLY. The support-resistance at $12.90 was frequently challenged. |
| Graphic provided by: StockCharts.com. |
| |
| The stochastic (14,3,3) has reached an oversold zone at 20 levels, indicating room for additional downside rally. But since the oscillator hit the support of the 20 levels on July 7, we might see a bounce back in the price rally with the support of $12.90 (see Figure 2). However, the ADX (14) at 21 is indicating the developing downtrend. |
| The bearish opening on July 8 would trigger the major corrective rally for DELL. The lower trendline of the ascending channel in Figure 2 would be violated and a fresh selling opportunity will be generated. |
Active trader in the Indian stock markets since 2003 and a full-time writer. Trading is largely based upon technical analysis.
| Company: | Independent |
| Address: | C1/3 Parth Indraprasth Towers. Vastrapur |
| Ahmedabad, Guj 380015 | |
| E-mail address: | chaitalimohile@yahoo.co.in |
Traders' Resource Links | |
| Independent has not added any product or service information to TRADERS' RESOURCE. | |
Click here for more information about our publications!
Comments
Date: 07/12/09Rank: 5Comment:
Date: 07/14/09Rank: 5Comment:

Request Information From Our Sponsors
- StockCharts.com, Inc.
- Candle Patterns
- Candlestick Charting Explained
- Intermarket Technical Analysis
- John Murphy on Chart Analysis
- John Murphy's Chart Pattern Recognition
- John Murphy's Market Message
- MurphyExplainsMarketAnalysis-Intermarket Analysis
- MurphyExplainsMarketAnalysis-Visual Analysis
- StockCharts.com
- Technical Analysis of the Financial Markets
- The Visual Investor
- VectorVest, Inc.
- Executive Premier Workshop
- One-Day Options Course
- OptionsPro
- Retirement Income Workshop
- Sure-Fire Trading Systems (VectorVest, Inc.)
- Trading as a Business Workshop
- VectorVest 7 EOD
- VectorVest 7 RealTime/IntraDay
- VectorVest AutoTester
- VectorVest Educational Services
- VectorVest OnLine
- VectorVest Options Analyzer
- VectorVest ProGraphics v6.0
- VectorVest ProTrader 7
- VectorVest RealTime Derby Tool
- VectorVest Simulator
- VectorVest Variator
- VectorVest Watchdog
