

HOT TOPICS LIST
- MACD
- Fibonacci
- RSI
- Gann
- ADXR
- Stochastics
- Volume
- Triangles
- Futures
- Cycles
- Volatility
- ZIGZAG
- MESA
- Retracement
- Aroon
INDICATORS LIST
LIST OF TOPICS
PRINT THIS ARTICLE
by Chaitali Mohile
The Dow Jones Industrial Average plunged to a neckline support. Will the index ignore the pattern and surge higher or will it break down?
Position: Sell
Chaitali Mohile
Active trader in the Indian stock markets since 2003 and a full-time writer. Trading is largely based upon technical analysis.
PRINT THIS ARTICLE
HEAD & SHOULDERS
An End Of The Bull Run For DJIA?
07/09/09 01:01:03 PMby Chaitali Mohile
The Dow Jones Industrial Average plunged to a neckline support. Will the index ignore the pattern and surge higher or will it break down?
Position: Sell
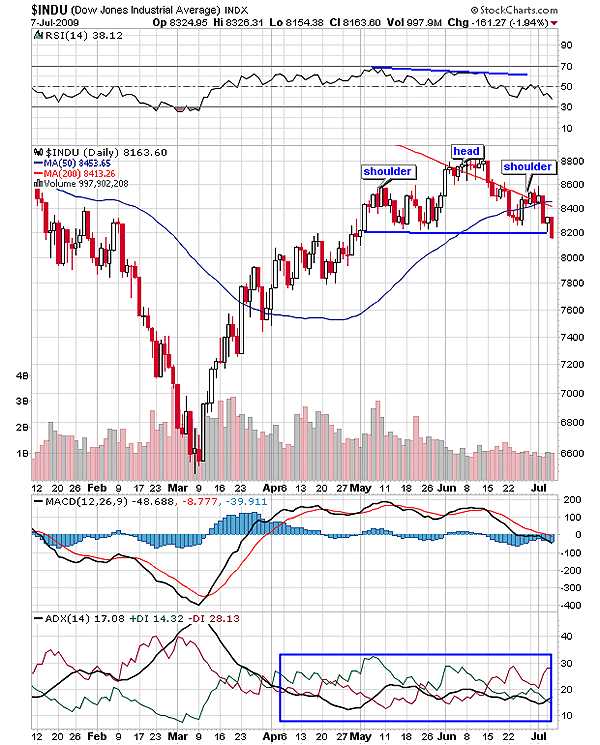
| The Dow Jones Industrial Average ($INDU) had resistance at 8400 and 8600 for the current bullish ride. The index recovered nearly 2,000 points from 6600 levels. During the pullback rally, $INDU formed a first peak at 8600 level with the support of 8200 level. Later, it moved higher at 8800 and drowned to the previous support at 8200, and the height of third peak in Figure 1 was equivalent to the first. This suggests a head & shoulders formation, a bearish reversal pattern with neckline support at 8200. Since the pattern is hardly two months old, we consider it to be a short-term formation. The volume failed to rise along with the price levels. As you can see in Figure 1, the volume increased at the first high near 8600 level and dropped as the second top was built. Thus, the bearish reversal pattern was reconfirmed. |
|
| FIGURE 1: $INDU, DAILY. The volume increased at the first high near the 8600 level and dropped as the second top was built. |
| Graphic provided by: StockCharts.com. |
| |
| The relative strength index (RSI) (14) ranged in an overbought area above 50. But the oscillator formed a negative divergence while the second peak on the price chart was being formed. Currently, the RSI (14) is under the 50 level resistance, indicating a weakness in the bullish rally. The average directional movement index (ADX) (14) shows a lack of strength to capture either of the trends during the entire upward move. Earlier, a high buying pressure supported the rally to surge toward the previous highs. However, as the head & shoulders pattern was anticipated, the bearish force on the ADX (14) accelerated. If this scenario continues, the ADX (14) would soon reflect a developing downtrend above the 20 level. As a result, the bearish breakout of the pattern was power-packed, dragging $INDU to the 7600 level. The moving average convergence/divergence (MACD) (12,26,9) was highly volatile in positive territory. The fresh breakdown of the pattern is likely to drag the indicator below the zero line (negative territory). |
| The bearish crossover of the 200-day moving average (MA) and the 50-day MA in Figure 1 is an additional bearish signal, generating bearish momentum in the pattern breakout; 7600 is a potential target below the neckline (8800 - 8200 = 600 - 8200 = 7600). Therefore, $INDU is likely to initiate the fresh downtrend. The previous bullish rally would change the direction after the breakdown. |
|
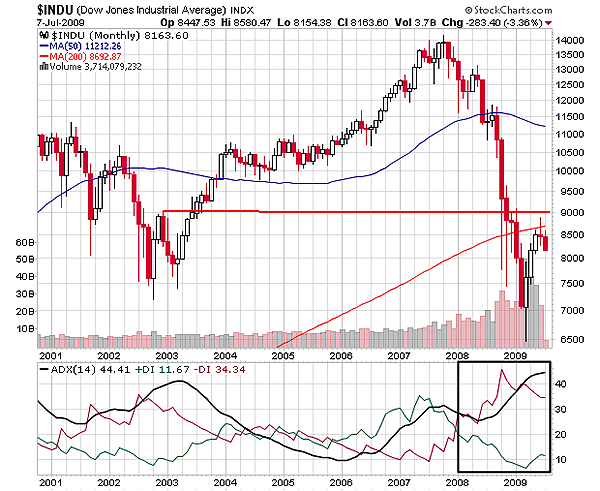
| FIGURE 2: $INDU, MONTHLY. $INDU has not breached the 200-day MA resistance on the monthly time frame. |
| Graphic provided by: StockCharts.com. |
| |
| For your ready reference, $INDU has not breached the 200-day MA resistance on the monthly time frame in Figure 2. In fact, the index had one more resistance at 9000 level above the 200-day MA that remained untouched during the pullback rally. An overheated downtrend on the long-term time frame does not signify any declining move. Therefore, the bearish scenario would finish up the bull ride. |
Active trader in the Indian stock markets since 2003 and a full-time writer. Trading is largely based upon technical analysis.
| Company: | Independent |
| Address: | C1/3 Parth Indraprasth Towers. Vastrapur |
| Ahmedabad, Guj 380015 | |
| E-mail address: | chaitalimohile@yahoo.co.in |
Traders' Resource Links | |
| Independent has not added any product or service information to TRADERS' RESOURCE. | |
Click here for more information about our publications!
Comments
Date:�07/10/09Rank:�4Comment:�
Date:�07/14/09Rank:�5Comment:�

Request Information From Our Sponsors
- StockCharts.com, Inc.
- Candle Patterns
- Candlestick Charting Explained
- Intermarket Technical Analysis
- John Murphy on Chart Analysis
- John Murphy's Chart Pattern Recognition
- John Murphy's Market Message
- MurphyExplainsMarketAnalysis-Intermarket Analysis
- MurphyExplainsMarketAnalysis-Visual Analysis
- StockCharts.com
- Technical Analysis of the Financial Markets
- The Visual Investor
- VectorVest, Inc.
- Executive Premier Workshop
- One-Day Options Course
- OptionsPro
- Retirement Income Workshop
- Sure-Fire Trading Systems (VectorVest, Inc.)
- Trading as a Business Workshop
- VectorVest 7 EOD
- VectorVest 7 RealTime/IntraDay
- VectorVest AutoTester
- VectorVest Educational Services
- VectorVest OnLine
- VectorVest Options Analyzer
- VectorVest ProGraphics v6.0
- VectorVest ProTrader 7
- VectorVest RealTime Derby Tool
- VectorVest Simulator
- VectorVest Variator
- VectorVest Watchdog