HOT TOPICS LIST
- MACD
- Fibonacci
- RSI
- Gann
- ADXR
- Stochastics
- Volume
- Triangles
- Futures
- Cycles
- Volatility
- ZIGZAG
- MESA
- Retracement
- Aroon
INDICATORS LIST
LIST OF TOPICS
PRINT THIS ARTICLE
by Donald W. Pendergast, Jr.
Southern Copper, one of the big winners during the basic materials sector bull run (2001-07), now appears to be on track to complete an anticipated 20-week cycle low, with bullish implications for daily based swing traders.
Position: Accumulate
Donald W. Pendergast, Jr.
Donald W. Pendergast is a financial markets consultant who offers specialized services to stock brokers and high net worth individuals who seek a better bottom line for their portfolios.
PRINT THIS ARTICLE
CYCLES
Southern Copper Nearing Major Weekly Cycle Low
07/09/09 12:45:53 PMby Donald W. Pendergast, Jr.
Southern Copper, one of the big winners during the basic materials sector bull run (2001-07), now appears to be on track to complete an anticipated 20-week cycle low, with bullish implications for daily based swing traders.
Position: Accumulate
| Southern Copper (PCU) had quite a run going in its common shares during the massive basic materials bull market that lasted from 2001 to 2007. PCU sold for a mere $1.40 a share in November 2001 before finally topping out at $47.75 in October 2007, just before the broad US markets came unglued. Like many other stocks, it was a long, tortuous ride all the way down to the ultimate bear market lows made late in 2008. By then PCU had shed about 80% of its peak value and, for all intents and purposes, appeared to have been tossed into the bargain bin of equity excess, not likely to ever be heard from again. But from such depths of stock market despair, PCU has risen from the ashes, just like the proverbial phoenix of mythical literature. (Isn't that quite a coincidence, given that Southern Copper happens to be headquartered in Phoenix, AZ?) The big question now is this, can this bird keep on flying, or is it due to have its wings clipped again by the current downdraft in the broad US markets? Two unique views of PCU's weekly graph will help us to determine which outcome may be more likely in the weeks to come. |

|
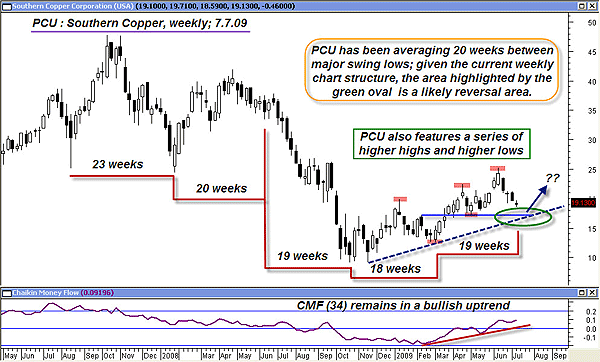
| FIGURE 1: PCU, WEEKLY. The area highlighted by the green oval may provide a general time/price zone in which to expect PCU to reverse higher. |
| Graphic provided by: MetaStock. |
| |
| Figure 1 focuses on three aspects of PCU's technical structure: its dominant weekly cycle (measured from swing low to swing low), its current money flow trend, and its major uptrend line. PCU has been averaging 20 weeks between major cycle lows over the past two years, and there appears to be little evidence to suggest that this timing pattern is about to change anytime soon. In fact, this week's bar is #19 since the last cycle low was made in late February of this year, so we may be getting very close to a weekly reversal setup in this stock. Since PCU is already in a de facto weekly uptrend (a series of higher highs and higher lows), with a very solid weekly uptrend line in place, the scheduled arrival of the 20-week cycle right near PCU's uptrend line bodes favorably for copper mining bulls. This takes on even more bullish significance when taking the trend of the Chaikin money flow indicator (CMF) (34) into consideration. Despite the recent retracement move in the stock, the weekly money flow trend (bottom of the chart) has taken nary a hit and is still holding in a major uptrend pattern. Overall, this chart presents a very bullish scenario, should the stock reverse off of the uptrend line in the next one to three weeks. |

|
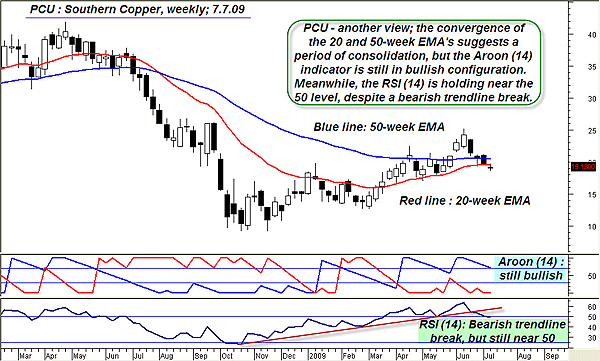
| FIGURE 2: PCU, WEEKLY. This particular view of the same stock displays a mix of bullish, bearish, and neutral technical indicators. The addition of a cyclical measurement (as seen in Figure 1) can help a trader make better sense of nearly any technical chart. |
| Graphic provided by: MetaStock. |
| |
| Figure 2, the next weekly chart, attempts to measure the trend intensity of PCU, using the Aroon (14) and RSI (14) indicators along with two of the more important moving average pairs, the 20-week and 50-week exponential moving averages (EMAs). Even on this chart, there is a modest amount of bullish evidence: the Aroon is still in bullish territory; note the separation of the blue (bullish) and red (bearish) lines that make up the indicator -- as long as the lines stay well separated, with the blue near the top of the range and the red near the bottom of the range, the uptrend is presumed to be intact. Currently, the blue line has retraced, but if it turns higher along with the anticipated 20-week reversal cycle, it will be a significant bullish confirmation. Next, witness the relative strength index (RSI) (14) at the bottom of the chart. It's maintaining a reading near 50, but the bullish uptrend of the indicator has already broken down, a possible warning of further weakness in PCU shares. Nevertheless, if the cyclical turn happens, the RSI will reverse higher (remember, price action drives these kinds of momentum indicators, and not the other way around). Finally, the convergence of the red 20-week EMA with the blue 50-week EMA is also worthy of note; either the stock is pausing (consolidating) before another move up or it's simply topping prior to a more substantial decline, duration unknown. Those of you who read Traders.com Advantage regularly already know that the Standard & Poor's 500 (.SPX, SPY) and Russell 2000 (.RUT, IWM) indexes are already on track to make their own 20-week cycle lows later this month, so it would not be surprising to see PCU also decline for another one to three weeks before reversing in sync with these two broad market indexes. In trading and investing, timing is everything; wise traders will patiently wait for a few more weeks before initiating any new long stock positions, including those in PCU. |
| As for how to best play PCU, should we see that weekly cycle low and subsequent reversal move occur soon, here are a few ideas to consider: * Sell a $22.50 September call for every 100 shares of PCU you intend to acquire. If this is actually going to be a major bullish turn for PCU (and the broad markets), you stand to cash in two ways -- from the capital appreciation of the stock and the option income received when you sell the call. The next major resistance zone in this stock is $25.24, so a major reversal from say, $17 or $18 could have plenty of room to run. More conservative investors might consider the sale of a $20 or even a $17.50 September covered call. You can also use the existing weekly uptrend line as your stop-loss point on the trade, too. * Daily based swing traders could also cash in on such a major turn, too. Simply waiting for the stochRSI (10) indicator to turn up across its lower signal line is one of the more accurate trade entry triggers available, especially when the higher time frame of the stock (ETF, commodity, whatever) is already in a confirmed uptrend, as is already shown to be in existence in PCU's weekly charts. Then just follow up on the entry with a three-bar trailing stop of the lows, letting the stop take you out of the trade automatically. |
| Timing a potential reversal with cyclical analysis isn't magic, but it should help tremendously with your trade entry/exit decisions. Try it in the stocks you follow and see if it doesn't immediately help improve your trading account's bottom line. |
Donald W. Pendergast is a financial markets consultant who offers specialized services to stock brokers and high net worth individuals who seek a better bottom line for their portfolios.
| Title: | Writer, market consultant |
| Company: | Linear Trading Systems LLC |
| Jacksonville, FL 32217 | |
| Phone # for sales: | 904-239-9564 |
| E-mail address: | lineartradingsys@gmail.com |
Traders' Resource Links | |
| Linear Trading Systems LLC has not added any product or service information to TRADERS' RESOURCE. | |
Click here for more information about our publications!
Comments
Date: 07/11/09Rank: 2Comment:

|

Request Information From Our Sponsors
- StockCharts.com, Inc.
- Candle Patterns
- Candlestick Charting Explained
- Intermarket Technical Analysis
- John Murphy on Chart Analysis
- John Murphy's Chart Pattern Recognition
- John Murphy's Market Message
- MurphyExplainsMarketAnalysis-Intermarket Analysis
- MurphyExplainsMarketAnalysis-Visual Analysis
- StockCharts.com
- Technical Analysis of the Financial Markets
- The Visual Investor
- VectorVest, Inc.
- Executive Premier Workshop
- One-Day Options Course
- OptionsPro
- Retirement Income Workshop
- Sure-Fire Trading Systems (VectorVest, Inc.)
- Trading as a Business Workshop
- VectorVest 7 EOD
- VectorVest 7 RealTime/IntraDay
- VectorVest AutoTester
- VectorVest Educational Services
- VectorVest OnLine
- VectorVest Options Analyzer
- VectorVest ProGraphics v6.0
- VectorVest ProTrader 7
- VectorVest RealTime Derby Tool
- VectorVest Simulator
- VectorVest Variator
- VectorVest Watchdog
