

HOT TOPICS LIST
- MACD
- Fibonacci
- RSI
- Gann
- ADXR
- Stochastics
- Volume
- Triangles
- Futures
- Cycles
- Volatility
- ZIGZAG
- MESA
- Retracement
- Aroon
INDICATORS LIST
LIST OF TOPICS
PRINT THIS ARTICLE
by Koos van der Merwe
The pattern is there, a very obvious head & shoulder pattern.
Position: Sell
Koos van der Merwe
Has been a technical analyst since 1969, and has worked as a futures and options trader with First Financial Futures in Johannesburg, South Africa.
PRINT THIS ARTICLE
HEAD & SHOULDERS
A Head & Shoulders Negative For The DJIA?
07/09/09 08:39:25 AMby Koos van der Merwe
The pattern is there, a very obvious head & shoulder pattern.
Position: Sell
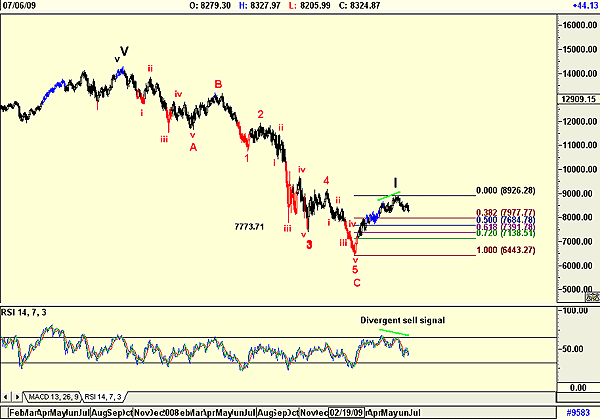
| The Elliott current wave count is a very definite Elliott wave 1 in a new bull market. After a wave 1 comes a wave 2, which history has shown can be anything from a small correction to 100% correction, if not greater. Looking at the daily chart of the Dow Jones Industrial Average (DJIA), however, we see a very possible head & shoulder pattern, which gives us a clue as to where the wave 2 correction should bottom. |
|
| FIGURE 1: DJIA, DAILY. Here's a detailed chart of the DJIA showing a wave count. |
| Graphic provided by: AdvancedGET. |
| |
| Figure 1 is a daily chart of the DJIA showing the wave count of wave C; the wave I start of the new bull market and the start of the wave 2 correction, with possible target levels for the low of the wave based on Fibonacci retracement levels of the range of wave 1. The relative strength index (RSI) gave a divergent sell signal confirming the start of the wave 2 correction. |
|
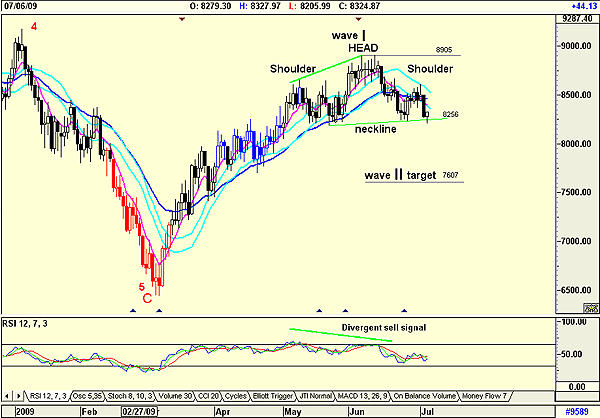
| FIGURE 2: DJIA, DAILY. Here's an enlarged chart of the DJIA showing a possible head & shoulder pattern. |
| Graphic provided by: AdvancedGET. |
| |
| Figure 2 is an enlarged daily chart of the DJIA, which shows the head & shoulder pattern that has developed. The neckline suggests that should the DJIA fall below 8256, then it should fall to a target of 7607. So is this indeed the low of the wave 2 correction? Until proven otherwise, we must assume that it will be. But we should keep in mind the Fibonacci retracement levels, should the head & shoulder target be a temporary support level only. Do note that the closest Fibonacci level to the target level of 7607 is the 50% retracement level at 7684. Finally, do note the divergent sell signal given by the RSI, which is showing further weakness ahead. The indicator is not yet at oversold levels. The DJIA appears to be forming a head & shoulders pattern with a target of 7607. Whether or not the pattern is a certainty, it should affect a large number of technicians causing them to either sit on the sidelines or sell their holdings. Either way, we can expect weakness ahead for the DJIA as a very defined wave 2 correction develops. |
Has been a technical analyst since 1969, and has worked as a futures and options trader with First Financial Futures in Johannesburg, South Africa.
| Address: | 3256 West 24th Ave |
| Vancouver, BC | |
| Phone # for sales: | 6042634214 |
| E-mail address: | petroosp@gmail.com |
Click here for more information about our publications!
Comments
Date:�07/11/09Rank:�5Comment:�

Request Information From Our Sponsors
- StockCharts.com, Inc.
- Candle Patterns
- Candlestick Charting Explained
- Intermarket Technical Analysis
- John Murphy on Chart Analysis
- John Murphy's Chart Pattern Recognition
- John Murphy's Market Message
- MurphyExplainsMarketAnalysis-Intermarket Analysis
- MurphyExplainsMarketAnalysis-Visual Analysis
- StockCharts.com
- Technical Analysis of the Financial Markets
- The Visual Investor
- VectorVest, Inc.
- Executive Premier Workshop
- One-Day Options Course
- OptionsPro
- Retirement Income Workshop
- Sure-Fire Trading Systems (VectorVest, Inc.)
- Trading as a Business Workshop
- VectorVest 7 EOD
- VectorVest 7 RealTime/IntraDay
- VectorVest AutoTester
- VectorVest Educational Services
- VectorVest OnLine
- VectorVest Options Analyzer
- VectorVest ProGraphics v6.0
- VectorVest ProTrader 7
- VectorVest RealTime Derby Tool
- VectorVest Simulator
- VectorVest Variator
- VectorVest Watchdog