HOT TOPICS LIST
- MACD
- Fibonacci
- RSI
- Gann
- ADXR
- Stochastics
- Volume
- Triangles
- Futures
- Cycles
- Volatility
- ZIGZAG
- MESA
- Retracement
- Aroon
INDICATORS LIST
LIST OF TOPICS
PRINT THIS ARTICLE
by Mike Carr, CMT
Commercial traders have turned bullish on the S&P 500.
Position: N/A
Mike Carr, CMT
Mike Carr, CMT, is a member of the Market Technicians Association, and editor of the MTA's newsletter, Technically Speaking. He is also the author of "Smarter Investing in Any Economy: The Definitive Guide to Relative Strength Investing," and "Conquering the Divide: How to Use Economic Indicators to Catch Stock Market Trends."
PRINT THIS ARTICLE
STRATEGIES
Commitment Of Traders Report Turns Bullish
07/09/09 08:23:48 AMby Mike Carr, CMT
Commercial traders have turned bullish on the S&P 500.
Position: N/A
| The Commitment of Traders (COT) report is released every Friday by the Commodities and Futures Trading Commission. It reveals the relative positions of hedgers (usually thought of as food and energy companies and producers) and speculators (hedge funds and individuals). Most analysts believe that hedgers will be right more often than not and speculators, especially individuals, are doomed to failure. |
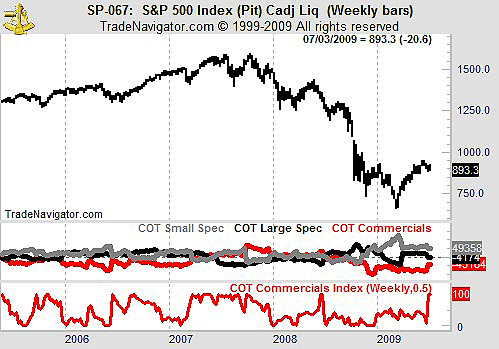
| In last week's report, we saw that hedgers increased their positions in the Standard & Poor's 500 (Figure 1). The middle pane of that chart shows the commercials as the red line. The black line indicates that large speculators have decreased their positions in the past week, while small speculators have been decreasing their positions since the March bottom. |

|
| FIGURE 1: S&P 500, WEEKLY. The S&P 500 with COT data supports the idea that recent market action is a consolidation in a bull market. |
| Graphic provided by: Trade Navigator. |
| |
| Last week, there was a large spike in the relative size of the hedgers' position. The bottom line in Figure 1 shows their position as a percentage of its value over the past six months. This is similar to the idea of a stochastic indicator. In the chart, we see that they now have their largest long position in some time. |
| Testing indicates this relative shift is significant. We looked at how the market performed after the indicator rose above 90. One week later, the market is higher 68.2% of the time. A month later, the market shows a gain 69.0% of the time. |
Mike Carr, CMT, is a member of the Market Technicians Association, and editor of the MTA's newsletter, Technically Speaking. He is also the author of "Smarter Investing in Any Economy: The Definitive Guide to Relative Strength Investing," and "Conquering the Divide: How to Use Economic Indicators to Catch Stock Market Trends."
| Website: | www.moneynews.com/blogs/MichaelCarr/id-73 |
| E-mail address: | marketstrategist@gmail.com |
Click here for more information about our publications!
Comments
Date: 07/11/09Rank: 1Comment:

Request Information From Our Sponsors
- VectorVest, Inc.
- Executive Premier Workshop
- One-Day Options Course
- OptionsPro
- Retirement Income Workshop
- Sure-Fire Trading Systems (VectorVest, Inc.)
- Trading as a Business Workshop
- VectorVest 7 EOD
- VectorVest 7 RealTime/IntraDay
- VectorVest AutoTester
- VectorVest Educational Services
- VectorVest OnLine
- VectorVest Options Analyzer
- VectorVest ProGraphics v6.0
- VectorVest ProTrader 7
- VectorVest RealTime Derby Tool
- VectorVest Simulator
- VectorVest Variator
- VectorVest Watchdog
- StockCharts.com, Inc.
- Candle Patterns
- Candlestick Charting Explained
- Intermarket Technical Analysis
- John Murphy on Chart Analysis
- John Murphy's Chart Pattern Recognition
- John Murphy's Market Message
- MurphyExplainsMarketAnalysis-Intermarket Analysis
- MurphyExplainsMarketAnalysis-Visual Analysis
- StockCharts.com
- Technical Analysis of the Financial Markets
- The Visual Investor
