HOT TOPICS LIST
- MACD
- Fibonacci
- RSI
- Gann
- ADXR
- Stochastics
- Volume
- Triangles
- Futures
- Cycles
- Volatility
- ZIGZAG
- MESA
- Retracement
- Aroon
INDICATORS LIST
LIST OF TOPICS
PRINT THIS ARTICLE
by Donald W. Pendergast, Jr.
An equal-weight ETF index composed of agricultural commodities, gold miners, oil/gas producers, and steel makers is very close to a major support test of a large daily based head & shoulders pattern.
Position: N/A
Donald W. Pendergast, Jr.
Donald W. Pendergast is a financial markets consultant who offers specialized services to stock brokers and high net worth individuals who seek a better bottom line for their portfolios.
PRINT THIS ARTICLE
HEAD & SHOULDERS
Commodity-Linked ETFs Nearing Chart Pattern Completion
07/08/09 10:25:18 AMby Donald W. Pendergast, Jr.
An equal-weight ETF index composed of agricultural commodities, gold miners, oil/gas producers, and steel makers is very close to a major support test of a large daily based head & shoulders pattern.
Position: N/A
| About a month ago, I alerted readers to the emerging uptrends in agricultural commodities, gold miners, energy producers, and steel makers. Combining all four of the exchange traded funds (ETFs) that mirror the action in these groups, I created a custom equal-weight index to simplify the technical action into a single, easy-to-decipher chart, one that could keep me alerted both to current trading opportunities and also for the possibility of future consumer price inflation. Given that all four of these commodity-linked groups are key barometers of inflationary pressures, it does seem like a wise move to keep an eye on the overall trend of these particular ETFs. |

|
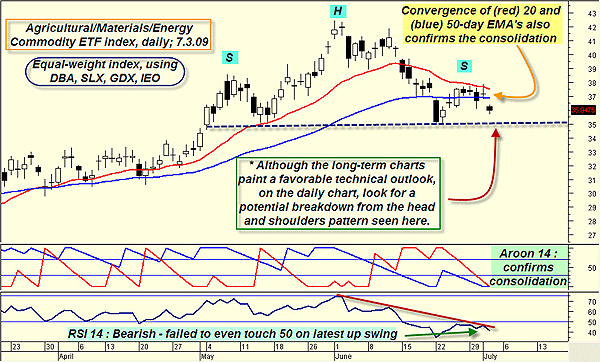
| FIGURE 1: EQUAL-WEIGHT INDEX, DAILY. Technically, this custom commodity-linked ETF index is in a consolidation area, but be aware of the bearish implications of a break of the H+S support line. |
| Graphic provided by: MetaStock. |
| |
| While the weekly and monthly trends in the index are still favorable for commodity bulls, the daily chart is depicting a very different situation (figure 1). First off, the large head & shoulders (H+S) pattern is within $1.00 of being complete; the main thing to watch for is what prices do as they approach the support line defining the entire pattern. Traditionally, chart pattern analysts view the breakdown of this kind of H+S pattern as being very bearish, with the possibility of a measured move to lower price levels being likely. In this case, a measured move might take prices all the way down toward the $27.60 area, but that would be an extreme move. Predicting the financial markets is about as easy as predicting the weather, but at the very least, such chart patterns do provide a rational basis for projecting price targets. As always, context is the key, so let's see what other chart technicals are saying here. The Aroon (14) indicator shows both the up (blue) and down (red) trend lines converging near the lower range of its window, confirming that neither a strong uptrend nor downtrend currently exists. This index is currently in a consolidation. Beneath that we see that the daily RSI (14) is in a confirmed downtrend, having failed to even reach the 50 level on the last up swing. So the chart technicals do seem to suggest that a test of the major H+S support line is likely to occur soon. Anyone currently long DBA, GDX, IEO, or SLX would do well to monitor his or her positions, given the possibility for a powerful breakdown from the index's H+S pattern. |

|
| FIGURE 2: FOUR ETFS. Of the four ETFs used to create this equal-weight index, agricultural commodities (DBA) have the weakest long-term relative strength. |
| Graphic provided by: MetaStock. |
| |
| Unless you can construct custom indexes in your own software, the next best thing to do would be to calculate the relative strength of these four ETFs to see which one is the weakest and then seek out the weakest relative strength stocks from that particular ETF. Currently, DBA (Powershares DB Agriculture ETF) is the weakest in terms of long-term relative strength (Figure 2). However, DBA doesn't hold equities but rather agricultural commodity contracts like corn, wheat, soybeans, and sugar. You might want to consider watching DBA's price action near its major support zone of $24.60-25.00 to see if the ETF is a sell or a wait and see. |

|
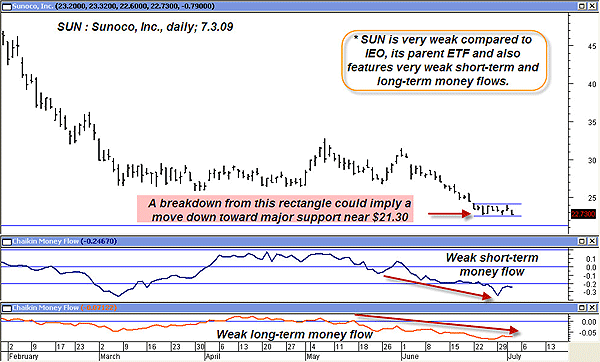
| FIGURE 3: SUN, DAILY. A weak stock from a weak parent ETF (IEO), SUN may be on the verge of yet another move lower. Watch the rectangle for a daily close below it (or above it); the weak money flows would seem to favor the short side, however. |
| Graphic provided by: MetaStock. |
| |
| Second on the list is IEO (iShares Dow Jones US Oil & Gas Exploration ETF). The weakest stock in this ETF is Sunoco, Inc. (SUN), based on a 13-week rate of change calculation versus IEO, its parent ETF. SUN features very weak short-term and long-term money flows and is also in the midst of a small rectangle pattern, one of which, if violated to the downside, might provide traders with an easy short trade move down toward $21.30, which is a major support level in this stock. See Figure 3. |
Donald W. Pendergast is a financial markets consultant who offers specialized services to stock brokers and high net worth individuals who seek a better bottom line for their portfolios.
| Title: | Writer, market consultant |
| Company: | Linear Trading Systems LLC |
| Jacksonville, FL 32217 | |
| Phone # for sales: | 904-239-9564 |
| E-mail address: | lineartradingsys@gmail.com |
Traders' Resource Links | |
| Linear Trading Systems LLC has not added any product or service information to TRADERS' RESOURCE. | |
Click here for more information about our publications!
Comments
Date: 07/11/09Rank: 4Comment:

|

Request Information From Our Sponsors
- StockCharts.com, Inc.
- Candle Patterns
- Candlestick Charting Explained
- Intermarket Technical Analysis
- John Murphy on Chart Analysis
- John Murphy's Chart Pattern Recognition
- John Murphy's Market Message
- MurphyExplainsMarketAnalysis-Intermarket Analysis
- MurphyExplainsMarketAnalysis-Visual Analysis
- StockCharts.com
- Technical Analysis of the Financial Markets
- The Visual Investor
- VectorVest, Inc.
- Executive Premier Workshop
- One-Day Options Course
- OptionsPro
- Retirement Income Workshop
- Sure-Fire Trading Systems (VectorVest, Inc.)
- Trading as a Business Workshop
- VectorVest 7 EOD
- VectorVest 7 RealTime/IntraDay
- VectorVest AutoTester
- VectorVest Educational Services
- VectorVest OnLine
- VectorVest Options Analyzer
- VectorVest ProGraphics v6.0
- VectorVest ProTrader 7
- VectorVest RealTime Derby Tool
- VectorVest Simulator
- VectorVest Variator
- VectorVest Watchdog
