HOT TOPICS LIST
- MACD
- Fibonacci
- RSI
- Gann
- ADXR
- Stochastics
- Volume
- Triangles
- Futures
- Cycles
- Volatility
- ZIGZAG
- MESA
- Retracement
- Aroon
INDICATORS LIST
LIST OF TOPICS
PRINT THIS ARTICLE
by Koos van der Merwe
The Canadian stock market is heavily weighted with resource companies, so why does it follow the Dow Jones 30 so closely and not the S&P 500?
Position: Hold
Koos van der Merwe
Has been a technical analyst since 1969, and has worked as a futures and options trader with First Financial Futures in Johannesburg, South Africa.
PRINT THIS ARTICLE
ELLIOTT WAVE
The Toronto Stock Exchange Index
07/08/09 01:04:04 PMby Koos van der Merwe
The Canadian stock market is heavily weighted with resource companies, so why does it follow the Dow Jones 30 so closely and not the S&P 500?
Position: Hold
| The Dow Jones Industrial Average (DJIA) vs. Standard & Poors 500 is a question that highlights an enigma for those who follow both the Canadian and US markets. The current recession has not been felt in Canada as badly as it has been in the United States, although Canadian Finance Minister Flaherty keeps revising his forecasts downward so it could be that Canada's recession is as bad if not worse than that of the US. However, the Toronto Stock Exchange 300 index, although heavily weighted toward commodities, does seem to track the Dow Jones Industrial Average (DJIA) more than the S&P 500, suggesting whatever its weighting, whatever happens south of the border, seriously affects the Canadian market. |

|
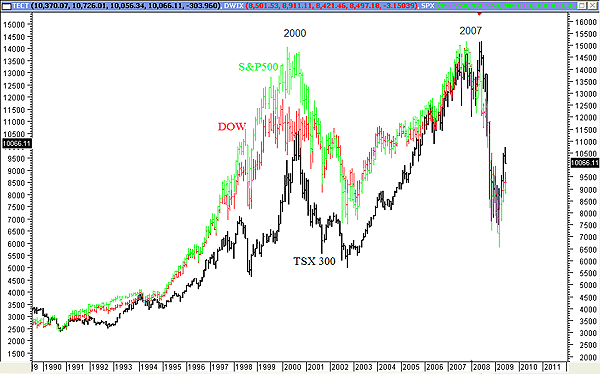
| FIGURE 1: COMPOSITE OF S&P 500, DJIA, AND TSX300 |
| Graphic provided by: MetaStock. |
| |
| Figure 1 is a composite chart of the DJIA, the S&P 500, and the TSX300 index. Note how the high of the S&P 500 in 2007 was at the same level as the high in 2000, whereas with both the DJIA and the TSX 300, the high in 2000 was much lower than the high of 2007. This difference led us to attempt a different Elliott wave count for the DJIA and TSX 300 than that of S&P 500. |

|
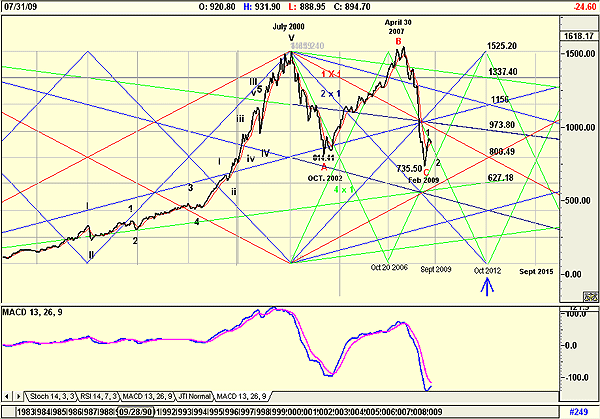
| FIGURE 2: S&P 500, MONTHLY |
| Graphic provided by: AdvancedGET. |
| |
| Figure 2 is a Gann/Elliott wave chart of the S&P 500 showing how the high of 2000 is wave V and the high of 2007 is wave B. The recent decline was wave C and that index appears to be correcting in wave 2 of a new bull impulse wave. |

|
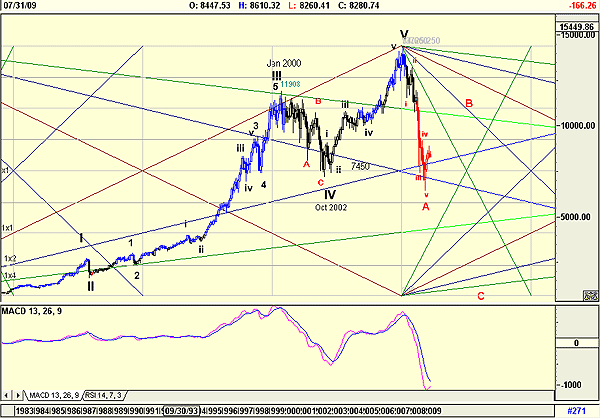
| FIGURE 3: DOW JONES INDUSTRIAL AVERAGE, MONTHLY |
| Graphic provided by: AdvancedGET. |
| |
| Figure 3 is a monthly chart of the DJIA and shows an Elliot wave count different to that of the S&P 500, suggesting that a wave B is still to come. |

|
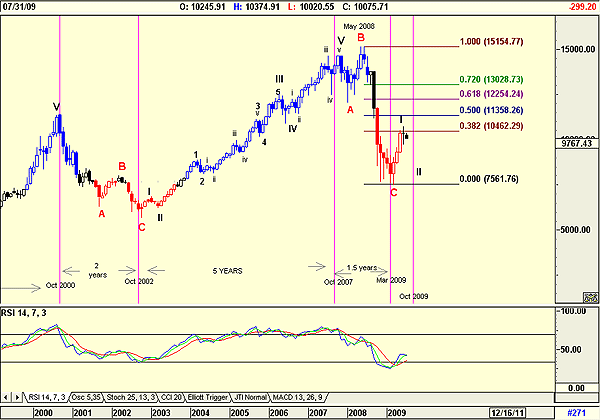
| FIGURE 4: TSX300, MONTHLY |
| Graphic provided by: AdvancedGET. |
| |
| In Figure 4, the TSX monthly, I have attempted to match the wave count to that of the S&P 500 rather than to that of the DJIA. In the chart, I have shown the high of May 2008 as a wave B top. Note how the recent rise met resistance at 10462.29, the 38.2% retracement level. Note too the time scale on the chart, suggesting that the current correction to the wave 1 rise could bottom in October 2009. All three indexes and the Elliott wave count suggest that a correction is now on the cards. The TSX300 and the S&P 500 suggest that the correction is a wave 2 of a new impulse wave upward in a new bull market. The DJIA, on the other hand, suggests that the correction could be a wave b down in a wave B upward. A wave 2 is more than often a 72% retracement of a wave 1. Wave Bs, however, are difficult to predict, whether it is a major or minor B-wave. Note too that in the chart of the S&P 500 and in the chart of the DJIA, the MACD is turning, suggesting strength, but has NOT yet confirmed a buy signal by crossing the nine-period moving average of the MACD line. With the TSX 300 chart, I have shown a relative strength index (RSI), and this has given a buy signal. Whatever the Elliot wave count, for the long term, all three indexes are suggesting buy and hold. For the short term, a correction is now due, suggesting that opportunities will soon exist to buy stocks as they bottom. |
Has been a technical analyst since 1969, and has worked as a futures and options trader with First Financial Futures in Johannesburg, South Africa.
| Address: | 3256 West 24th Ave |
| Vancouver, BC | |
| Phone # for sales: | 6042634214 |
| E-mail address: | petroosp@gmail.com |
Click here for more information about our publications!
PRINT THIS ARTICLE

Request Information From Our Sponsors
- VectorVest, Inc.
- Executive Premier Workshop
- One-Day Options Course
- OptionsPro
- Retirement Income Workshop
- Sure-Fire Trading Systems (VectorVest, Inc.)
- Trading as a Business Workshop
- VectorVest 7 EOD
- VectorVest 7 RealTime/IntraDay
- VectorVest AutoTester
- VectorVest Educational Services
- VectorVest OnLine
- VectorVest Options Analyzer
- VectorVest ProGraphics v6.0
- VectorVest ProTrader 7
- VectorVest RealTime Derby Tool
- VectorVest Simulator
- VectorVest Variator
- VectorVest Watchdog
- StockCharts.com, Inc.
- Candle Patterns
- Candlestick Charting Explained
- Intermarket Technical Analysis
- John Murphy on Chart Analysis
- John Murphy's Chart Pattern Recognition
- John Murphy's Market Message
- MurphyExplainsMarketAnalysis-Intermarket Analysis
- MurphyExplainsMarketAnalysis-Visual Analysis
- StockCharts.com
- Technical Analysis of the Financial Markets
- The Visual Investor
