HOT TOPICS LIST
- MACD
- Fibonacci
- RSI
- Gann
- ADXR
- Stochastics
- Volume
- Triangles
- Futures
- Cycles
- Volatility
- ZIGZAG
- MESA
- Retracement
- Aroon
INDICATORS LIST
LIST OF TOPICS
PRINT THIS ARTICLE
by Ron Walker
The continuous contract on crude oil is now showing signs of weakness after failing to rise above the peak made in mid-June. The seasonality cycle of crude oil usually causes prices to rise in the summer months. Could crude oil prices have already peaked, even though the summer season is just getting under way?
Position: N/A
Ron Walker
Ron Walker is an active trader and technical analyst. He operates an educational website dedicated to the study of Technical Analysis. The website offers free market analysis with daily video presentations and written commentaries. Ron is a video pioneer, being one of the first to utilize the internet producing Technical Analysis videos. His website is thechartpatterntrader.com
PRINT THIS ARTICLE
DOUBLE TOPS
A Double Top Looms Over Crude Oil
07/08/09 01:00:52 PMby Ron Walker
The continuous contract on crude oil is now showing signs of weakness after failing to rise above the peak made in mid-June. The seasonality cycle of crude oil usually causes prices to rise in the summer months. Could crude oil prices have already peaked, even though the summer season is just getting under way?
Position: N/A
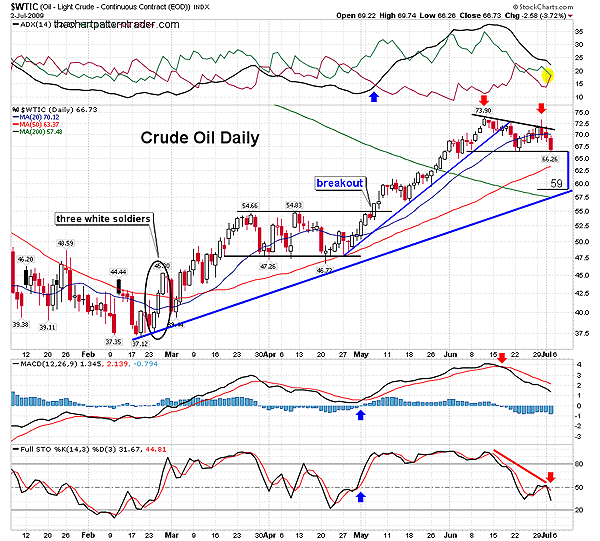
| Figure 1 shows the continuous contract on crude oil ($WTIC) racked up a huge gain since February lows as a three-white soldier candle pattern led the march higher. After a hefty upward push in March, prices began to consolidate, forming a base from the latter part of March into early May between the $47 and $55 areas. Just before prices climbed out of the range, prices jumped above the 20-day simple moving average (SMA) while the moving average convergence/divergence (MACD) firmed up and got a bullish touch just above zero. Then a few days later, on May 6, WTIC broke out of the base and prices quickly gained approximately 19 points over the next six weeks, peaking at $73.90 a barrel. As the advance continued, prices became extended as a mature uptrend formed an accelerated trendline. |

|
| FIGURE 1: $WTIC, DAILY. After the breaking of the accelerating trendline in mid-June, prices developed a double-top pattern. Momentum is waning with the positive and negative DI lines getting a bearish cross (highlighted in yellow), while the stochastic line hooked lower at 50. |
| Graphic provided by: StockCharts.com. |
| |
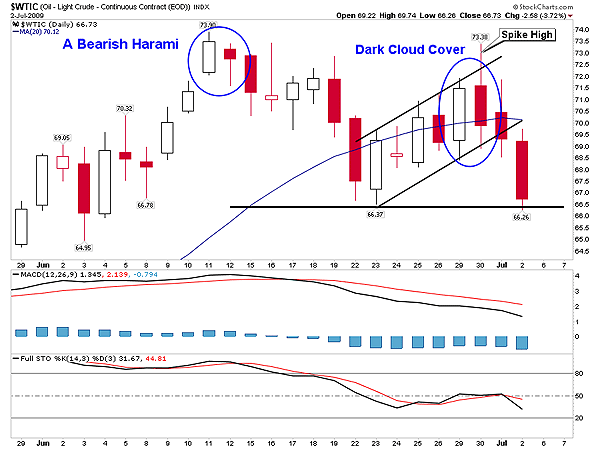
| In mid-June, the bears tore down from the accelerated trendline with one quick swipe. After a brief backtest, prices began to lose altitude and sank back to the 20-day SMA. Upon penetrating the level, WTIC waned low to test the last minor low near $66. WTIC attempted to recover from the earlier slide as another rally carried prices up to test the previous high. But the bears began to rock the boat once again at resistance. WTIC hesitated at resistance, having a difficult time hurdling over the 20-day SMA. Figure 2 reveals that a bear flag formed in an abbreviated channel after prices found support at $66. The bulls gave it the old college try, making several attempts to keep prices above the 20-day SMA. However, prices finally subsided and ultimately collapsed. |

|
| FIGURE 2: $WTIC, DAILY. This chart shows two distinctive tops near $73. Each peak has its own distinguishing characteristics. The first top produced a bearish harami pattern, which occurs when the second day of the pattern is contained within the first. The third day confirmed the harami. The second peak was a dark cloud cover two-day pattern, which included a spike high to test the prior peak. |
| Graphic provided by: StockCharts.com. |
| |
| On June 30, the last day that prices remained in the channel, crude blasted higher toward the previous high of $73.90, putting in an intraday high of $73.38. There was a great amount of hesitation at resistance, as the bulls were reluctant to climb higher. But all signs of a recovery were dashed when prices quickly retreated at resistance during that same trading session and closed once again below the 20-day SMA. At the close of a very volatile session on June 30, a bearish dark cloud cover candle pattern loomed over crude oil's daily chart. Note the long upper shadow on the candle for that session. It clearly established a reversal due to crude oil trading at an overextended level. This spike high is called a "climactic" or a "blowoff top" by the father of technical analysis, John Magee, in the book that he coauthored with Robert D. Edwards, Technical Analysis Of Stock Trends. This blowoff top marks the second peak near $73, setting up a potential double top (DT) pattern. The price action is also consistent with a bearish descending triangle pattern. It is noteworthy that both tops printed familiar candlestick reversal patterns. Prior to the current dark cloud cover pattern that has formed in this second peak, a bearish harami two-day candle pattern formed the first peak. That was followed by a confirmation candle that closed below the low of the first day of the pattern. |
| But I digress. The following session, WTIC confirmed the reversal as prices deteriorated lower, penetrating through the lower boundary of the channel (Figure 2). After that, on July 2, WTIC skidded back to the trough that separates the two peaks in a huge selloff, shedding another 3.75% in that one day, resting just above the confirmation line. If WTIC closes below the confirmation line, it will confirm the DT pattern. The DT pattern measures 7.53 points. The math is calculated by subtracting the trough low (66.37) from the peak (73.90) of the pattern. The difference is then subtracted from the pivot point at 66.37: 73.90 - 66.37 = 7.53 points (measurement of the pattern) 66.37 - 7.53 = 58.84 (the objective target) Glancing back at Figure 1, we can clearly see that a confluence of support comes into play near WTIC's objective target near $59. The very loose rising intermediate trendline, taken from the February's momentum lows, is pointing directly at our target. Likewise, the 200-day SMA is offering support just below that, as it now hovers near $57.50. Another tier of support lies at the previous five-week base that completed in early May. The breakout of that base at $55 now offers another layer of support, should the intermediate trendline be fractured. |
| The moving average convergence/divergence (MACD) (12, 26, 9) is consistent with the weakness demonstrated on the price chart (Figure 1). The MACD got a bearish cross on June 17 when prices took out the accelerated trendline. The sell signal has remained constant as prices drifted sideways to form the double-top pattern. The stochastic (14, 3, 3) recycled back up during the last rally, but the reversal off resistance near $73 stalled the momentum indicator near 50 as it rolled over, putting the bears back into the driver's seat. The average directional movement index (ADX) (14) signified weakness when it peaked after the accelerated trend broke, suggesting that the strong trend was now weakening. The positive and negative lines (+DI and -DI) on the directional movement indicator (DMI) have been intertwining ever since the trendline broke, suggesting trendlessness. This validates that the sideways price action has formed the DT pattern. Back in Figure 1, the -DI and +DI lines got a bearish cross, which could strengthen the bear's footing once the confirmation is broken. Crude oil has had a strong run, and it is overdue for a correction. Once the prices correct, crude oil may begin to carve out a very large consolidation pattern for the last half of 2009, such as a triangle or a rectangle. However, the bulls are still holding out hope at this late stage of the game. With a lower high now in place, it will only take a lower low to send them running for cover, which would also confirm the DT pattern. |
Ron Walker is an active trader and technical analyst. He operates an educational website dedicated to the study of Technical Analysis. The website offers free market analysis with daily video presentations and written commentaries. Ron is a video pioneer, being one of the first to utilize the internet producing Technical Analysis videos. His website is thechartpatterntrader.com
| Website: | thechartpatterntrader.com |
| E-mail address: | thechartpatterntrader@gmail.com |
Click here for more information about our publications!
Comments
Date: 07/11/09Rank: 5Comment:
Date: 06/18/10Rank: 5Comment:

Request Information From Our Sponsors
- VectorVest, Inc.
- Executive Premier Workshop
- One-Day Options Course
- OptionsPro
- Retirement Income Workshop
- Sure-Fire Trading Systems (VectorVest, Inc.)
- Trading as a Business Workshop
- VectorVest 7 EOD
- VectorVest 7 RealTime/IntraDay
- VectorVest AutoTester
- VectorVest Educational Services
- VectorVest OnLine
- VectorVest Options Analyzer
- VectorVest ProGraphics v6.0
- VectorVest ProTrader 7
- VectorVest RealTime Derby Tool
- VectorVest Simulator
- VectorVest Variator
- VectorVest Watchdog
- StockCharts.com, Inc.
- Candle Patterns
- Candlestick Charting Explained
- Intermarket Technical Analysis
- John Murphy on Chart Analysis
- John Murphy's Chart Pattern Recognition
- John Murphy's Market Message
- MurphyExplainsMarketAnalysis-Intermarket Analysis
- MurphyExplainsMarketAnalysis-Visual Analysis
- StockCharts.com
- Technical Analysis of the Financial Markets
- The Visual Investor
