HOT TOPICS LIST
- MACD
- Fibonacci
- RSI
- Gann
- ADXR
- Stochastics
- Volume
- Triangles
- Futures
- Cycles
- Volatility
- ZIGZAG
- MESA
- Retracement
- Aroon
INDICATORS LIST
LIST OF TOPICS
PRINT THIS ARTICLE
by Koos van der Merwe
There is now no doubt that the S&P 500 is in a new bull market, but ...
Position: Accumulate
Koos van der Merwe
Has been a technical analyst since 1969, and has worked as a futures and options trader with First Financial Futures in Johannesburg, South Africa.
PRINT THIS ARTICLE
ELLIOTT WAVE
What Now For The S&P 500?
07/08/09 08:40:21 AMby Koos van der Merwe
There is now no doubt that the S&P 500 is in a new bull market, but ...
Position: Accumulate
| When we listen to CNBC debates, there are many market participants who believe that the bear market in the US will continue, and that the recent upward move in the indexes was an upward correction in a bear market. That is what they believe, and they put their bets on it. Charts, however, suggest otherwise. |

|
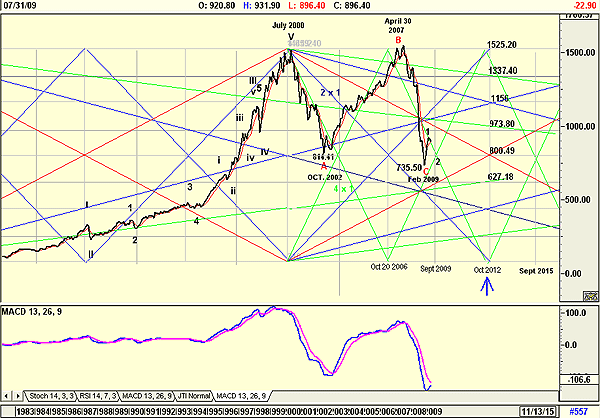
| FIGURE 1: S&P 500, MONTHLY |
| Graphic provided by: AdvancedGET. |
| |
| Figure 1, which is a monthly chart of the S&P 500, shows the following: - A move to a fifth-wave high in July 2000. - A correction of wave A to 814.41 on October 2002. - A rise in a B-wave to 1547 on April 30, 2007. - The fall in wave C to 735.50 on February 2009. - From the low of February 2009, the index rose in a new bull market in what could be a wave 1 of wave I. In other words, a new bull market appears to be forming that could last into the year 2026 (see my article on Kondratieff wave elsewhere in Traders.com Advantage.) - This is confirmed by the moving average convergence/divergence (MACD), which has turned and could finalize a buy signal at the low of wave 2 of wave I. - The chart is suggesting that the low of wave 2 of wave I could occur in September 2009. This date is determined by the Gann lines shown. Wave 2s are usually a 72% retracement of the rise of wave 1. This correction will definitely have the bears shouting "hallelujah" from the rooftops. - WD Gann's wave analysis is a study in itself. Needless to say, Gann's charting techniques led him to become one of the greatest chartists of the 20th century with many followers. - The chart suggests a wave 2 correction to 800.49 by approximately September 2009. This will bolster bear market pundits, and give wonderful buy opportunities for bull market believers. To conclude, we could expect the S&P 500 to correct in a wave 2 of what I believe is a wave I of a new bull market, probably finding a low in September/October 2009. This will give us the opportunity to look for lows in the stocks we would like to own. For the next few months, therefore, be prepared for a down market, or with luck, more of a sideways correction as the Obama/Geithner financial strategy takes effect. |
Has been a technical analyst since 1969, and has worked as a futures and options trader with First Financial Futures in Johannesburg, South Africa.
| Address: | 3256 West 24th Ave |
| Vancouver, BC | |
| Phone # for sales: | 6042634214 |
| E-mail address: | petroosp@gmail.com |
Click here for more information about our publications!
Comments
Date: 07/09/09Rank: 1Comment: To say Obama/Geithner financial strategy and bull market in the same article is an oxymoron. Obama is a socialist and is turning the United States in to a fascist state-----can you show us charts whereby a free market system went under government control and had a bull rally? Seriously, not being cute----I would really like to see it. I follow Elliott Waves too, and there are different interpretations----applying socioeconomics and politics does help explain waves, and I cannot see how we could be starting a new bull market when the United States has been hijacked by a fascist government and media.
Date: 07/10/09Rank: 5Comment:

Request Information From Our Sponsors
- StockCharts.com, Inc.
- Candle Patterns
- Candlestick Charting Explained
- Intermarket Technical Analysis
- John Murphy on Chart Analysis
- John Murphy's Chart Pattern Recognition
- John Murphy's Market Message
- MurphyExplainsMarketAnalysis-Intermarket Analysis
- MurphyExplainsMarketAnalysis-Visual Analysis
- StockCharts.com
- Technical Analysis of the Financial Markets
- The Visual Investor
- VectorVest, Inc.
- Executive Premier Workshop
- One-Day Options Course
- OptionsPro
- Retirement Income Workshop
- Sure-Fire Trading Systems (VectorVest, Inc.)
- Trading as a Business Workshop
- VectorVest 7 EOD
- VectorVest 7 RealTime/IntraDay
- VectorVest AutoTester
- VectorVest Educational Services
- VectorVest OnLine
- VectorVest Options Analyzer
- VectorVest ProGraphics v6.0
- VectorVest ProTrader 7
- VectorVest RealTime Derby Tool
- VectorVest Simulator
- VectorVest Variator
- VectorVest Watchdog
