HOT TOPICS LIST
- MACD
- Fibonacci
- RSI
- Gann
- ADXR
- Stochastics
- Volume
- Triangles
- Futures
- Cycles
- Volatility
- ZIGZAG
- MESA
- Retracement
- Aroon
INDICATORS LIST
LIST OF TOPICS
PRINT THIS ARTICLE
by Koos van der Merwe
This company is the sole survivor of the US auto industry, and the charts show it.
Position: Accumulate
Koos van der Merwe
Has been a technical analyst since 1969, and has worked as a futures and options trader with First Financial Futures in Johannesburg, South Africa.
PRINT THIS ARTICLE
TRIANGLES
Ford, The Survivor Of An American Industry
07/07/09 04:00:00 PMby Koos van der Merwe
This company is the sole survivor of the US auto industry, and the charts show it.
Position: Accumulate
| What lies in the future? Is the company strong enough to survive the recession, the slowdown in sales? The charts say yes. |

|
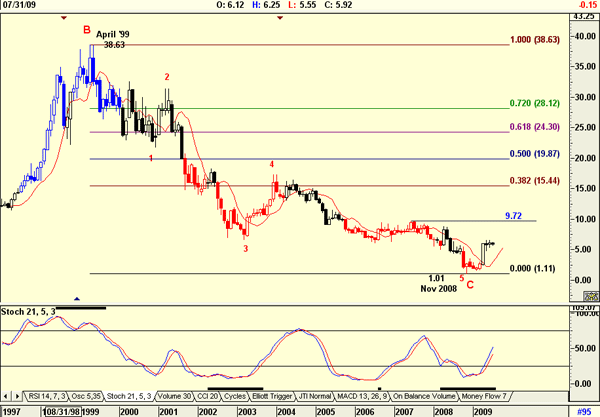
| FIGURE 1: FORD, MONTHLY |
| Graphic provided by: AdvancedGET. |
| |
| Figure 1, a monthly chart, shows how the price has fallen in a five-wave C-wave, from a high of $38.63 in April 1999 to a low of $1.01 by November 2008. The chart suggests that Ford Motor Co. is on the mend and the price should now rise in a wave 1 of a new bull market. The Fibonacci retracement suggests targets for this rise with the 15.44, the 38.2% level being the most likely because of its coincidence with a major resistance level. My preferred indicator, a stochastic 21,5,3 suggests a rise in the price. The chart suggests an interim resistance at $9.72. |

|
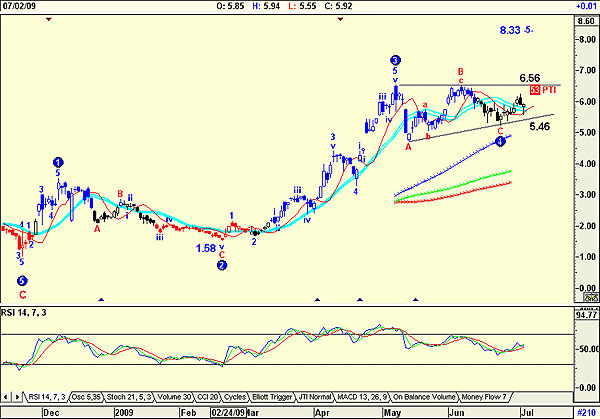
| FIGURE 2: FORD, DAILY |
| Graphic provided by: AdvancedGET. |
| |
| Figure 2, a daily chart, shows that the price is tracing a wave 4 correction in a wave 1 rise. A consolidation triangle is forming, with a breakout buy signal at 6.56 and a target of $11.54 (6.56 - 1.58 = 4.98 + 6.56 = 11.54) and a wave 5 target of $8.33. The probability index (PTI) of this happening is 53%, not as strong as we would like, but acceptable. The relative strength index (RSI), however, is suggesting weakness in the short term, probably to retest the support line at $6.56. Ford is a stock worth watching. For the first time in 53 years, it has taken the lead in sales in June. Management is sound and its debt is being properly managed. |
Has been a technical analyst since 1969, and has worked as a futures and options trader with First Financial Futures in Johannesburg, South Africa.
| Address: | 3256 West 24th Ave |
| Vancouver, BC | |
| Phone # for sales: | 6042634214 |
| E-mail address: | petroosp@gmail.com |
Click here for more information about our publications!
Comments
Date: 07/08/09Rank: 3Comment:

Request Information From Our Sponsors
- StockCharts.com, Inc.
- Candle Patterns
- Candlestick Charting Explained
- Intermarket Technical Analysis
- John Murphy on Chart Analysis
- John Murphy's Chart Pattern Recognition
- John Murphy's Market Message
- MurphyExplainsMarketAnalysis-Intermarket Analysis
- MurphyExplainsMarketAnalysis-Visual Analysis
- StockCharts.com
- Technical Analysis of the Financial Markets
- The Visual Investor
- VectorVest, Inc.
- Executive Premier Workshop
- One-Day Options Course
- OptionsPro
- Retirement Income Workshop
- Sure-Fire Trading Systems (VectorVest, Inc.)
- Trading as a Business Workshop
- VectorVest 7 EOD
- VectorVest 7 RealTime/IntraDay
- VectorVest AutoTester
- VectorVest Educational Services
- VectorVest OnLine
- VectorVest Options Analyzer
- VectorVest ProGraphics v6.0
- VectorVest ProTrader 7
- VectorVest RealTime Derby Tool
- VectorVest Simulator
- VectorVest Variator
- VectorVest Watchdog
