HOT TOPICS LIST
- MACD
- Fibonacci
- RSI
- Gann
- ADXR
- Stochastics
- Volume
- Triangles
- Futures
- Cycles
- Volatility
- ZIGZAG
- MESA
- Retracement
- Aroon
INDICATORS LIST
LIST OF TOPICS
PRINT THIS ARTICLE
by Chaitali Mohile
After a huge correction, the CRB index formed a strong bullish reversal pattern. Will the pattern break out successfully?
Position: N/A
Chaitali Mohile
Active trader in the Indian stock markets since 2003 and a full-time writer. Trading is largely based upon technical analysis.
PRINT THIS ARTICLE
ROUND TOP & BOTTOM
CRB Index Ready To Break Out?
07/08/09 07:34:20 AMby Chaitali Mohile
After a huge correction, the CRB index formed a strong bullish reversal pattern. Will the pattern break out successfully?
Position: N/A
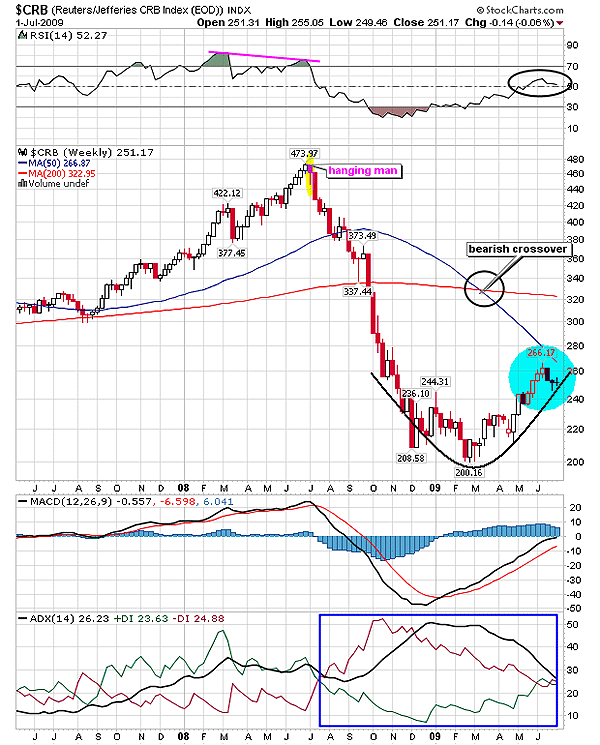
| A hanging man candlestick pattern and a negative divergence of the relative strength index (RSI) (14) in Figure 1 of Reuters/Jefferies CRB index ($CRB) was an alarming bearish reversal signal. The bullish rally of the index halted on these bearish notes and plunged to 200 levels, losing almost 50% of the value. A downtrend that was initiated by the robust correction in July 2008 gradually hit overheated levels, indicating a trend change. In Figure 1, we can see the average directional movement index (ADX) (14) declining from 50 levels (highly overheated), and as a result, the sharp bearish rally moved sideways. The consolidation at the lowest level of correction signifies the bottom formation. |
| Instead of usual horizontal consolidation, $CRB formed a round-bottom pattern (see Figure 1). Although the index turned sideways, the pattern apparently generated bullish sentiments. The pattern is a bullish reversal, with the breakout above a moving average (MA) resistance. Technically, the round-bottom is constructed but the bullish breakout is yet to occur. The 50-day MA resistance is not violated. In fact, $CRB lacks the strength to breach its major resistance. The RSI (14) is shaky near the support at 50 levels, indicating weakness in an upward breakout of the oscillator. Therefore, $CRB is unable to hit the 50-day MA resistance. |

|
| FIGURE 1: $CRB, WEEKLY. The correction moved sideways and formed the rounded-bottom pattern. The bullish rally of the pattern failed to surge above the 50-day MA due to the bearish scenario on the technical chart. |
| Graphic provided by: StockCharts.com. |
| |
| Considering the technical indicators on the weekly chart in Figure 1, the pattern breakout looks difficult. The positive moving average convergence/divergence (MACD) (12,26,9) is below the zero-line. The momentum indicator is unlikely to surge into positive territory in the near term. The ADX (14) has declined to the developing downtrend level (above 20). In addition, the bearish moving average crossover of the 50-day moving average (MA) and the 200-day MA would depress traders. On the price chart in Figure 1, the blue circle shows a bearish candle and the doji, indicating uncertainty and instability of the rally. Under such circumstances, any further bullish action from 266 toward the 50-day MA is under threat. |
| $CRB is more likely to consolidate within the range of 240 and 260 levels before initiating any breakout journey above 266. Thus, the rounded-bottom pattern would fail due to the consolidated action. |
Active trader in the Indian stock markets since 2003 and a full-time writer. Trading is largely based upon technical analysis.
| Company: | Independent |
| Address: | C1/3 Parth Indraprasth Towers. Vastrapur |
| Ahmedabad, Guj 380015 | |
| E-mail address: | chaitalimohile@yahoo.co.in |
Traders' Resource Links | |
| Independent has not added any product or service information to TRADERS' RESOURCE. | |
Click here for more information about our publications!
Comments
Date: 07/08/09Rank: 3Comment:

Request Information From Our Sponsors
- VectorVest, Inc.
- Executive Premier Workshop
- One-Day Options Course
- OptionsPro
- Retirement Income Workshop
- Sure-Fire Trading Systems (VectorVest, Inc.)
- Trading as a Business Workshop
- VectorVest 7 EOD
- VectorVest 7 RealTime/IntraDay
- VectorVest AutoTester
- VectorVest Educational Services
- VectorVest OnLine
- VectorVest Options Analyzer
- VectorVest ProGraphics v6.0
- VectorVest ProTrader 7
- VectorVest RealTime Derby Tool
- VectorVest Simulator
- VectorVest Variator
- VectorVest Watchdog
- StockCharts.com, Inc.
- Candle Patterns
- Candlestick Charting Explained
- Intermarket Technical Analysis
- John Murphy on Chart Analysis
- John Murphy's Chart Pattern Recognition
- John Murphy's Market Message
- MurphyExplainsMarketAnalysis-Intermarket Analysis
- MurphyExplainsMarketAnalysis-Visual Analysis
- StockCharts.com
- Technical Analysis of the Financial Markets
- The Visual Investor
