HOT TOPICS LIST
- MACD
- Fibonacci
- RSI
- Gann
- ADXR
- Stochastics
- Volume
- Triangles
- Futures
- Cycles
- Volatility
- ZIGZAG
- MESA
- Retracement
- Aroon
INDICATORS LIST
LIST OF TOPICS
PRINT THIS ARTICLE
by Chaitali Mohile
Wells Fargo has been consolidating in a descending range for a long time now. Can the stock undergo a bullish breakout?
Position: N/A
Chaitali Mohile
Active trader in the Indian stock markets since 2003 and a full-time writer. Trading is largely based upon technical analysis.
PRINT THIS ARTICLE
CHART ANALYSIS
Wells Fargo Is Highly Volatile
06/30/09 11:26:17 AMby Chaitali Mohile
Wells Fargo has been consolidating in a descending range for a long time now. Can the stock undergo a bullish breakout?
Position: N/A
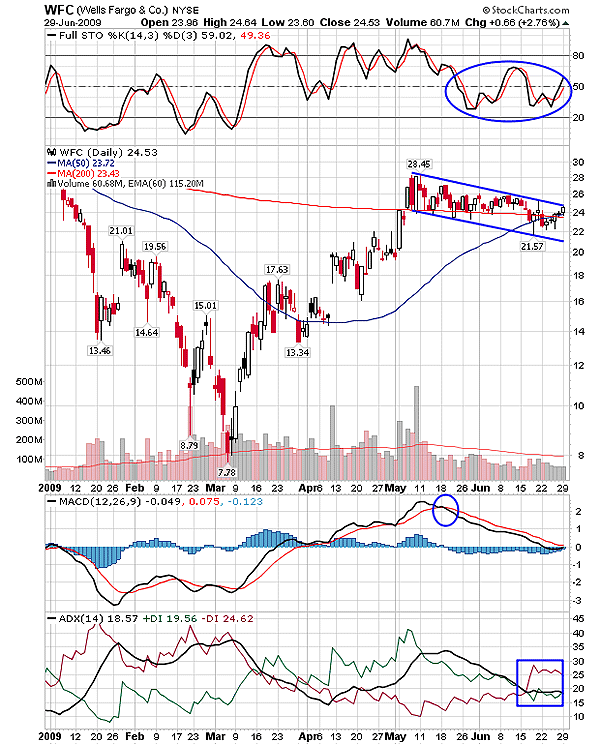
| The bullish rally of Wells Fargo Co. (WFC) from $7.78 rested with a support of the 200-day moving average (MA). Earlier, the 200-day MA was the strongest resistance that induced high volatility in the stock action. Converting this resistance to support was the major breakout for WFC. Most stocks generally consolidate either after an exclusive advance rally or on establishing fresh support at particular levels. But if the consolidation phase extends more than four weeks, the stock is likely to turn weak and enter a wild storm. In Figure 1, we can see that WFC is consolidating for almost two months after the bullish rally converted the 200-day MA and 50-day MA resistance to support. Although the strong support was established, the consolidation range declined, indicating weakness in the price action. |
| During the consolidation period, the full stochastic (14,3,3) was unstable near the support line at the 50 levels. The moving average convergence/divergence (MACD) (12,26,9) has turned negative after a bearish crossover. The average directional movement index (ADX) (14) has plunged below the 20 levels, along with the positive directional index (+DI) in Figure 2. The trend indicator is therefore suggesting consolidation with the support of MAs. The shaky stochastic oscillator, the negative MACD (12,26,9), and the weak trend might increase volatility. |

|
| FIGURE 1: WFC, DAILY. The consolidation in the declining range formed the descending channel. WFC is consolidating in the support-resistance zone of the 200-day and 50-day MA. |
| Graphic provided by: StockCharts.com. |
| |
| The trendlines drawn in Figure 1 show a descending channel -- a bearish formation. The channel formation adds the bearish view on the stock. Currently, the indicators are not reflecting any upward breakout. For a successful bullish breakout, WFC should breach the upper trendline resistance. According to the daily chart in Figure 1, a breakout seems unlikely. |

|
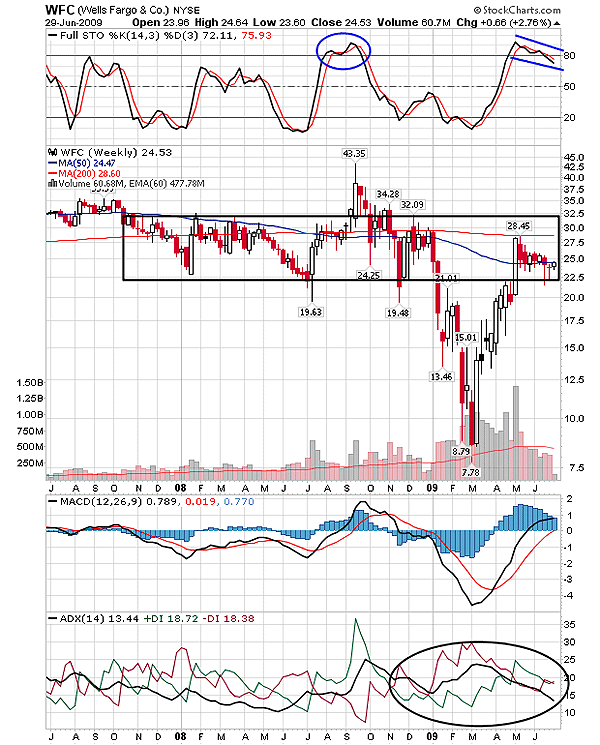
| FIGURE 2: WFC, WEEKLY. The bullish rally from $7.78 moved sideways under the 200-day MA resistance. |
| Graphic provided by: StockCharts.com. |
| |
| The marked rectangle on the weekly time frame in Figure 2 shows a crucial support-resistance trading zone. We can see that WFC witnessed a highly volatile session in this region. Apart from the wide ranges, the stock had a robust resistance of the 200-day and 50-day MA. WFC moved in close vicinity of these hurdles. The pullback rally from $7.78 was suppressed by the 200-day MA and dragged WFC lower to the 50-day MA support. Due to the earlier downside fall, the full stochastic is reluctant to sustain above the 80 levels. The ADX (14) below 15 levels is indicating volatile consolidation with the current support of 50-day MA. Although the MACD (12,26,9) is positive, following the oscillator in isolation is highly risky. The other two weak indicators would impose the bearish force on the positive MACD (12,26,9). |
| Therefore, the bullish breakout above the 200-day MA resistance is unlikely. In fact, WFC might consolidate in the crucial range between the two MAs. |
Active trader in the Indian stock markets since 2003 and a full-time writer. Trading is largely based upon technical analysis.
| Company: | Independent |
| Address: | C1/3 Parth Indraprasth Towers. Vastrapur |
| Ahmedabad, Guj 380015 | |
| E-mail address: | chaitalimohile@yahoo.co.in |
Traders' Resource Links | |
| Independent has not added any product or service information to TRADERS' RESOURCE. | |
Click here for more information about our publications!
PRINT THIS ARTICLE

Request Information From Our Sponsors
- VectorVest, Inc.
- Executive Premier Workshop
- One-Day Options Course
- OptionsPro
- Retirement Income Workshop
- Sure-Fire Trading Systems (VectorVest, Inc.)
- Trading as a Business Workshop
- VectorVest 7 EOD
- VectorVest 7 RealTime/IntraDay
- VectorVest AutoTester
- VectorVest Educational Services
- VectorVest OnLine
- VectorVest Options Analyzer
- VectorVest ProGraphics v6.0
- VectorVest ProTrader 7
- VectorVest RealTime Derby Tool
- VectorVest Simulator
- VectorVest Variator
- VectorVest Watchdog
- StockCharts.com, Inc.
- Candle Patterns
- Candlestick Charting Explained
- Intermarket Technical Analysis
- John Murphy on Chart Analysis
- John Murphy's Chart Pattern Recognition
- John Murphy's Market Message
- MurphyExplainsMarketAnalysis-Intermarket Analysis
- MurphyExplainsMarketAnalysis-Visual Analysis
- StockCharts.com
- Technical Analysis of the Financial Markets
- The Visual Investor
