HOT TOPICS LIST
- MACD
- Fibonacci
- RSI
- Gann
- ADXR
- Stochastics
- Volume
- Triangles
- Futures
- Cycles
- Volatility
- ZIGZAG
- MESA
- Retracement
- Aroon
INDICATORS LIST
LIST OF TOPICS
PRINT THIS ARTICLE
by Chaitali Mohile
NetEase seems to be a very strong and trustworthy long-term stock.
Position: Hold
Chaitali Mohile
Active trader in the Indian stock markets since 2003 and a full-time writer. Trading is largely based upon technical analysis.
PRINT THIS ARTICLE
TECHNICAL INDICATORS
NetEase In Stable Uptrend
06/29/09 10:50:44 AMby Chaitali Mohile
NetEase seems to be a very strong and trustworthy long-term stock.
Position: Hold
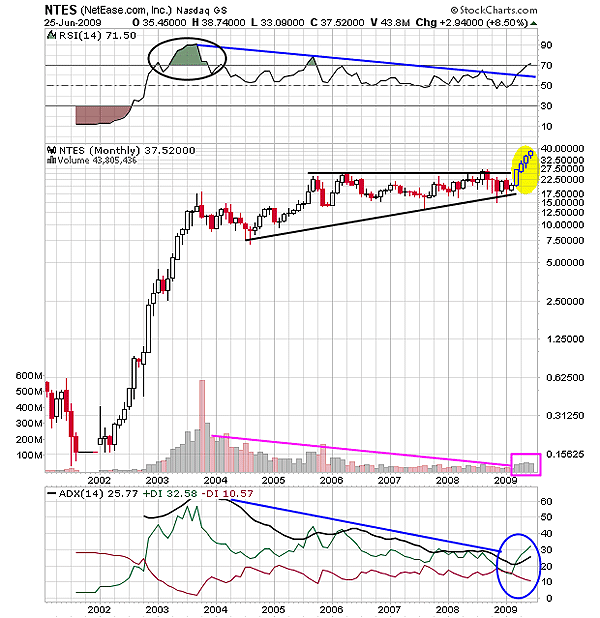
| Ever since NetEase.com (NTES) was listed, the stock has been in a robust uptrend. NTES began an upward journey in 2002 from a low of $0.156. Gradually, every higher level was hit due to a developing uptrend indicated by the average directional movement index (ADX)(14). In addition, bullish strength was injected by the relative strength index (RSI)(14) breakout from an oversold region. In Figure 1, the long bullish candles reflected strength in the rally. The upper and lower shadow of a few candles suggests the steady consolidated moves. By mid-2003, the stock reached $12.50 with a huge volume benefit. Although the profit of $12.50 within a time span of a year is not highly attractive, a stock with steady returns for a long-term investment is preferable. |
| Traders can also observe that the upward price action of NTES turned sideways from the $12.50 level due to an overheated ADX (14) and highly overbought RSI (14) (see Figure 1). However, the stock formed the new highs at every possible event during consolidation. The declining ADX (14) from the overheated levels never slipped below the 20 levels till 2008. The RSI (14) descended to the support of the 50 levels, indicating a negative divergence. But NTES did not plunge on this technical weakness, and as a result, bears failed to capture the stock. After a substantial bullish run, the stock moved horizontally for almost four years. In April 2009, the upper range of $27.50 was breached and a fresh bullish rally was initiated. |

|
| FIGURE 1: NTES, MONTHLY. The long-term consolidation range was breached in April 2009. The bullish indicators suggest a stable upward journey of NTES. |
| Graphic provided by: StockCharts.com. |
| |
| We can see in Figure 1 that the ADX (14) surged with support of the 20 levels, indicating a new developing uptrend. The RSI (14) is indicating bullish strength in the breakout rally. Currently, NTES is at an all-time high, but the shrinking size of the bullish candles signifies the possibility of a slowdown in the price action. The momentum and trend indicator are bullish; therefore, the stock would rally even higher from these levels. Hence, long-term traders and investors can continue holding their long positions. |

|
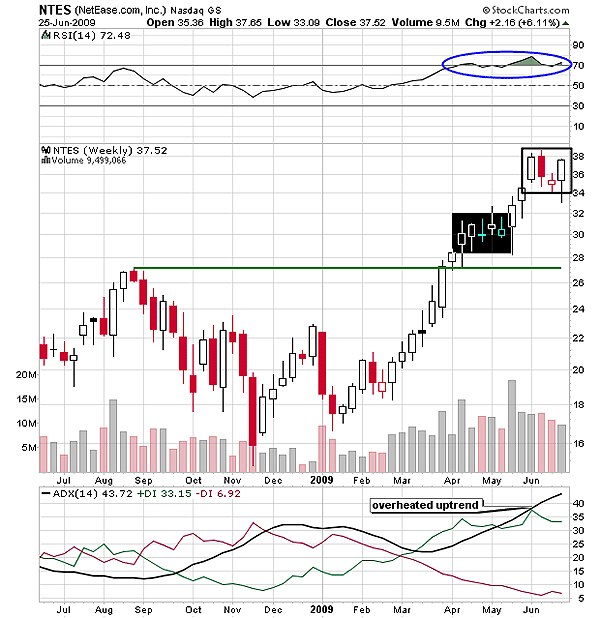
| FIGURE 2: NTES, WEEKLY. Although the ADX (14) is overheated, the uptrend has enough space to move higher. The trend indicator can extend up to highly overheated levels of 60. |
| Graphic provided by: StockCharts.com. |
| |
| In Figure 2 you can see that NTES consolidated above the previous high at $27 approximately (see the black block) but later broke upward, hitting a new high at $38. The overbought RSI (14) is likely to establish support at the 70 levels, so the bullish force is likely to sustain above $38 as well. The uptrend is overheated but the ADX (14) could rally further in an overheated zone. The indicator is not showing any signs of a downturn. Therefore, NTES would ride the bull with a marginally slow pace. The supports at $32 and $27 can be considered as stop-losses for the long-term trade. |
| Thus, NTES is a strong stock for long-term investments. |
Active trader in the Indian stock markets since 2003 and a full-time writer. Trading is largely based upon technical analysis.
| Company: | Independent |
| Address: | C1/3 Parth Indraprasth Towers. Vastrapur |
| Ahmedabad, Guj 380015 | |
| E-mail address: | chaitalimohile@yahoo.co.in |
Traders' Resource Links | |
| Independent has not added any product or service information to TRADERS' RESOURCE. | |
Click here for more information about our publications!
Comments
Date: 06/30/09Rank: 5Comment:

Request Information From Our Sponsors
- StockCharts.com, Inc.
- Candle Patterns
- Candlestick Charting Explained
- Intermarket Technical Analysis
- John Murphy on Chart Analysis
- John Murphy's Chart Pattern Recognition
- John Murphy's Market Message
- MurphyExplainsMarketAnalysis-Intermarket Analysis
- MurphyExplainsMarketAnalysis-Visual Analysis
- StockCharts.com
- Technical Analysis of the Financial Markets
- The Visual Investor
- VectorVest, Inc.
- Executive Premier Workshop
- One-Day Options Course
- OptionsPro
- Retirement Income Workshop
- Sure-Fire Trading Systems (VectorVest, Inc.)
- Trading as a Business Workshop
- VectorVest 7 EOD
- VectorVest 7 RealTime/IntraDay
- VectorVest AutoTester
- VectorVest Educational Services
- VectorVest OnLine
- VectorVest Options Analyzer
- VectorVest ProGraphics v6.0
- VectorVest ProTrader 7
- VectorVest RealTime Derby Tool
- VectorVest Simulator
- VectorVest Variator
- VectorVest Watchdog
