HOT TOPICS LIST
- MACD
- Fibonacci
- RSI
- Gann
- ADXR
- Stochastics
- Volume
- Triangles
- Futures
- Cycles
- Volatility
- ZIGZAG
- MESA
- Retracement
- Aroon
INDICATORS LIST
LIST OF TOPICS
PRINT THIS ARTICLE
by Mike Carr, CMT
The price of oil has risen dramatically this year, with analysts attributing much of the rise to geopolitical concerns. While unrest in Iran and terror attacks in Niger are likely to continue, traders seem to be less concerned about their impact on the supply of oil, and prices have backed off recent highs.
Position: N/A
Mike Carr, CMT
Mike Carr, CMT, is a member of the Market Technicians Association, and editor of the MTA's newsletter, Technically Speaking. He is also the author of "Smarter Investing in Any Economy: The Definitive Guide to Relative Strength Investing," and "Conquering the Divide: How to Use Economic Indicators to Catch Stock Market Trends."
PRINT THIS ARTICLE
STRATEGIES
Oil At A Short-Term Top?
06/29/09 09:03:47 AMby Mike Carr, CMT
The price of oil has risen dramatically this year, with analysts attributing much of the rise to geopolitical concerns. While unrest in Iran and terror attacks in Niger are likely to continue, traders seem to be less concerned about their impact on the supply of oil, and prices have backed off recent highs.
Position: N/A
| One widely watched technical indicator has just completed a setup for a sell signal. On the daily price chart of crude oil, the DeMark sequential, an indicator mostly used by professional traders, has just reached a count of 13. These signals attempt to identify turning points in the market by looking for times when prices have gone too far in the short term. A sell signal setup occurs when there have been nine consecutive daily price closes that are higher than the closes four days earlier. At that point, the countdown begins, and traders look for 13 closes, which are higher than the close two days earlier. That is where we are now. |
| Traders are now watching for a sell signal. This will occur if the market closes lower or higher than a close four days earlier. That means a close below $67.50 a barrel on June 29 would trigger the sell (the required price changes daily). DeMark indicators are used by hedge funds and other large traders. Bloomberg reports that these screens are accessed by more than 35,000 subscribers a day on their systems. While no indicator is 100% reliable, this is one that short-term, institutional traders are usually aware of and is worth watching. |
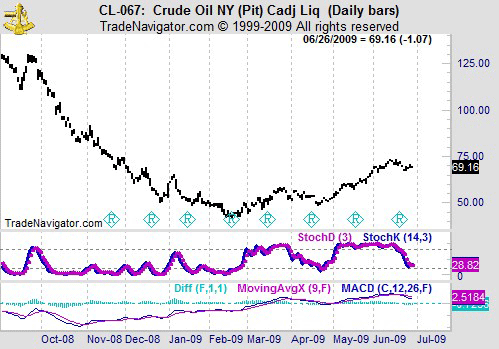
| More traditional indicators are also flashing warning signs. On the daily chart (Figure 1), we can see that both stochastics and the moving average convergence/divergence (MACD) broke down at the recent highs. This indicates momentum failed to confirm price, and often these indicators lead price. |

|
| FIGURE 1: CL-067, DAILY. With momentum failing to follow price higher, now is a good time for traders to consider taking profits in crude oil. |
| Graphic provided by: Trade Navigator. |
| |
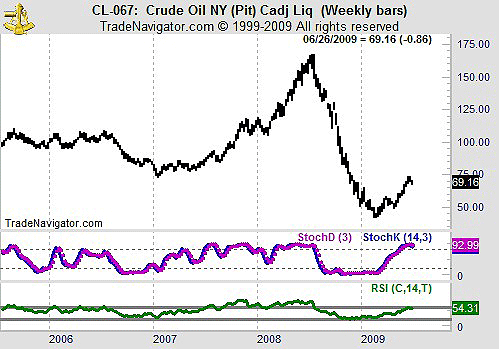
| The weekly chart (Figure 2) shows that stochastics is turning down on the longer time frame and, more important, that the relative strength index (RSI) never rose above 60 in the recent advance. This is the type of behavior that this indicator displays in a bear market rally. |

|
| FIGURE 2: CL-067, WEEKLY. Here, crude oil shows the extent of the bear market and indicates that further base building is likely before an extended bull market can occur. |
| Graphic provided by: Trade Navigator. |
| |
| With the weight of the evidence indicating that crude oil is more likely to decline than rise, traders should also be optimistic about the economy and consider making equity investments on the expectation that the economy will recover this year. |
Mike Carr, CMT, is a member of the Market Technicians Association, and editor of the MTA's newsletter, Technically Speaking. He is also the author of "Smarter Investing in Any Economy: The Definitive Guide to Relative Strength Investing," and "Conquering the Divide: How to Use Economic Indicators to Catch Stock Market Trends."
| Website: | www.moneynews.com/blogs/MichaelCarr/id-73 |
| E-mail address: | marketstrategist@gmail.com |
Click here for more information about our publications!
Comments
Date: 06/29/09Rank: 1Comment:

Request Information From Our Sponsors
- StockCharts.com, Inc.
- Candle Patterns
- Candlestick Charting Explained
- Intermarket Technical Analysis
- John Murphy on Chart Analysis
- John Murphy's Chart Pattern Recognition
- John Murphy's Market Message
- MurphyExplainsMarketAnalysis-Intermarket Analysis
- MurphyExplainsMarketAnalysis-Visual Analysis
- StockCharts.com
- Technical Analysis of the Financial Markets
- The Visual Investor
- VectorVest, Inc.
- Executive Premier Workshop
- One-Day Options Course
- OptionsPro
- Retirement Income Workshop
- Sure-Fire Trading Systems (VectorVest, Inc.)
- Trading as a Business Workshop
- VectorVest 7 EOD
- VectorVest 7 RealTime/IntraDay
- VectorVest AutoTester
- VectorVest Educational Services
- VectorVest OnLine
- VectorVest Options Analyzer
- VectorVest ProGraphics v6.0
- VectorVest ProTrader 7
- VectorVest RealTime Derby Tool
- VectorVest Simulator
- VectorVest Variator
- VectorVest Watchdog
