HOT TOPICS LIST
- MACD
- Fibonacci
- RSI
- Gann
- ADXR
- Stochastics
- Volume
- Triangles
- Futures
- Cycles
- Volatility
- ZIGZAG
- MESA
- Retracement
- Aroon
INDICATORS LIST
LIST OF TOPICS
PRINT THIS ARTICLE
by Chaitali Mohile
Is the Commodity Related Equity Index's bearish move done? If so, then how long can the new upward rally sustain?
Position: N/A
Chaitali Mohile
Active trader in the Indian stock markets since 2003 and a full-time writer. Trading is largely based upon technical analysis.
PRINT THIS ARTICLE
TECHNICAL ANALYSIS
$CRX Resuming Rally?
06/26/09 01:11:02 PMby Chaitali Mohile
Is the Commodity Related Equity Index's bearish move done? If so, then how long can the new upward rally sustain?
Position: N/A
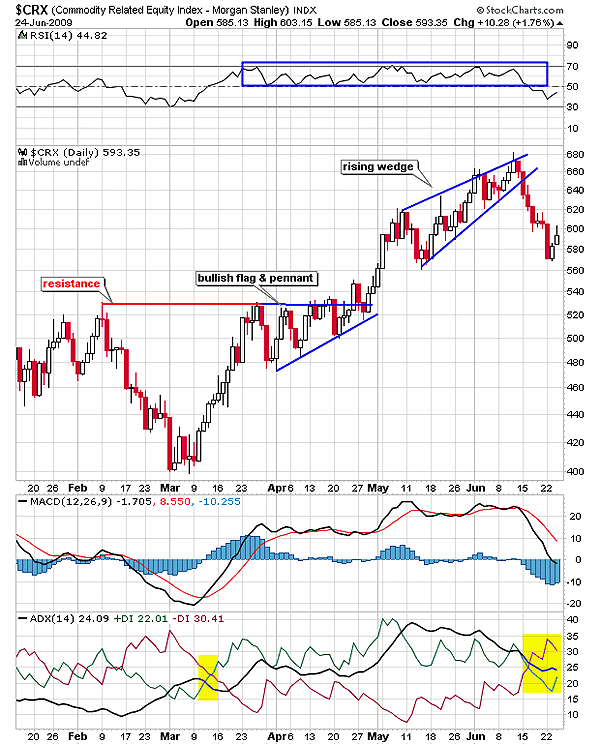
| In March 2009, we saw a downtrend reverssal in the Commodity Related Equity Index ($CRX). A significant bullish rally from 400 levels pulled all three technical indicators into bullish territory (see Figure 1). The average directional movement index (ADX) (14) moved in favor of bulls, the relative strength index (RSI) (14) established support at the 50 level, and the moving average convergence/divergence (MACD) (12,26,9) crossed the trigger line from below, indicating a bullish crossover in negative territory. The price rally from 400 gained massive strength. The consolidation in a converging range of 480 and 530 formed a bullish continuation pattern. Some traders might have observed the pattern as a bullish flag & pennant, and others may have seen an ascending triangle. The breakout rally in Figure 1 gradually turned volatile due to the range-bound RSI (14). The momentum indicator moved between the 50 and 70 bullish area. |

|
| FIGURE 1: CRX, DAILY. After the breakout, the volatile price action formed a rising wedge. |
| Graphic provided by: StockCharts.com. |
| |
| After the breakout, the volatile price action formed a rising wedge. The RSI (14) was ranged and the index made a higher high on the price chart in Figure 1. Therefore, a negative divergence of RSI (14) formed the rising wedge -- a bearish reversal formation. In Figure 1, $CRX has already hit the bearish target on the wedge. Usually, the rising wedge breakout retraces to the lowest level of the formation. According to Figure 1, 560 was the lowest point of the wedge, and the index retraced to 570 levels approximately after the breakout. The RSI (14) that slipped below 50 levels during the decline is likely to pull back. An upward swing of a positive directional index (+DI) of the ADX (14) suggests increasing buying pressure that might change the downtrend. |
| While correcting, $CRX consolidated between 620 and 600 levels. Thus, for the current rally the lower level of 600 is an immediate resistance. The indicators are not completely bullish to drag the index higher. There is a mixed indication on the technical chart in Figure 1 that might result in sideways price action. Traders can consider trading the equities from this index. However, the index has moved near resistance, and the long-term view on $CRX is not completely bullish. |

|
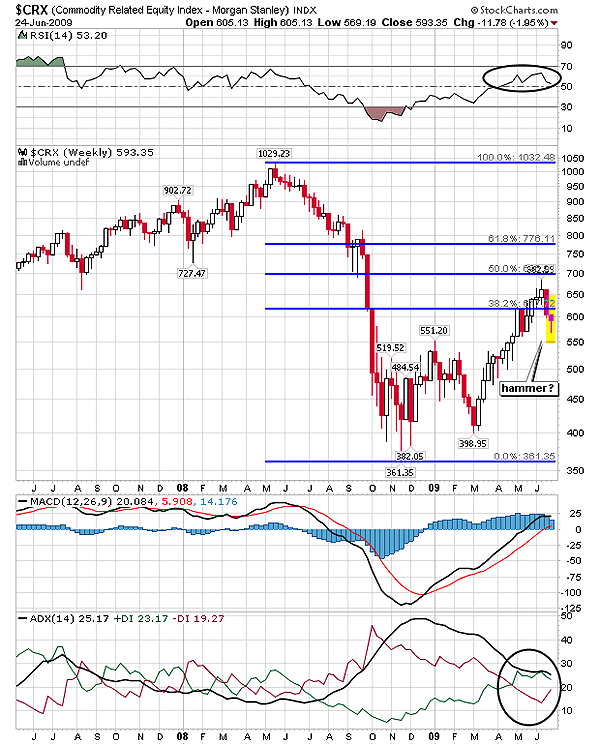
| FIGURE 2: CRX, WEEKLY. The long-term uptrend as seen here is developing. |
| Graphic provided by: StockCharts.com. |
| |
| The long-term uptrend is developing as seen in Figure 2. The price has rallied in one direction with very nominal consolidation. If the current week's candle is confirmed as a hammer candlestick pattern, then we can anticipate an upside price action with the target of a prior high of 700. These previous highs and lows play important roles in bull and bear markets as they are capable of changing the entire picture. Various stop-losses get triggered close to these levels. According to the Fibonacci retracement tool in Figure 2, $CRX has recovered up to the 50% level. However, a corrective rally after an extensive bullish run is considered healthy till it sustains above the major support levels. In Figure 2, we can see that the index has slipped marginally below the 38.2% level. |
| The RSI (14), though volatile, has established support over the 50 level, the MACD (12,26,9) could surge above the zero line, and the ADX (14) is indicating slow development in an uptrend. Therefore, on a weekly time frame, indicators are not bullish enough to carry the index higher. So the short-term traders should take a fast profit on their long traders; 700 levels could be the target of the current rally, according to current indications on the charts. |
Active trader in the Indian stock markets since 2003 and a full-time writer. Trading is largely based upon technical analysis.
| Company: | Independent |
| Address: | C1/3 Parth Indraprasth Towers. Vastrapur |
| Ahmedabad, Guj 380015 | |
| E-mail address: | chaitalimohile@yahoo.co.in |
Traders' Resource Links | |
| Independent has not added any product or service information to TRADERS' RESOURCE. | |
Click here for more information about our publications!
PRINT THIS ARTICLE

Request Information From Our Sponsors
- StockCharts.com, Inc.
- Candle Patterns
- Candlestick Charting Explained
- Intermarket Technical Analysis
- John Murphy on Chart Analysis
- John Murphy's Chart Pattern Recognition
- John Murphy's Market Message
- MurphyExplainsMarketAnalysis-Intermarket Analysis
- MurphyExplainsMarketAnalysis-Visual Analysis
- StockCharts.com
- Technical Analysis of the Financial Markets
- The Visual Investor
- VectorVest, Inc.
- Executive Premier Workshop
- One-Day Options Course
- OptionsPro
- Retirement Income Workshop
- Sure-Fire Trading Systems (VectorVest, Inc.)
- Trading as a Business Workshop
- VectorVest 7 EOD
- VectorVest 7 RealTime/IntraDay
- VectorVest AutoTester
- VectorVest Educational Services
- VectorVest OnLine
- VectorVest Options Analyzer
- VectorVest ProGraphics v6.0
- VectorVest ProTrader 7
- VectorVest RealTime Derby Tool
- VectorVest Simulator
- VectorVest Variator
- VectorVest Watchdog
