HOT TOPICS LIST
- MACD
- Fibonacci
- RSI
- Gann
- ADXR
- Stochastics
- Volume
- Triangles
- Futures
- Cycles
- Volatility
- ZIGZAG
- MESA
- Retracement
- Aroon
INDICATORS LIST
LIST OF TOPICS
PRINT THIS ARTICLE
by Donald W. Pendergast, Jr.
The weekly cycle in the major US stock indexes are all heading lower for now, but expect a major reversal once the swing lows are established, probably within the next three to six weeks.
Position: N/A
Donald W. Pendergast, Jr.
Donald W. Pendergast is a financial markets consultant who offers specialized services to stock brokers and high net worth individuals who seek a better bottom line for their portfolios.
PRINT THIS ARTICLE
CYCLES
S&P 500 Descending Toward Major Cycle Low
06/26/09 12:46:25 PMby Donald W. Pendergast, Jr.
The weekly cycle in the major US stock indexes are all heading lower for now, but expect a major reversal once the swing lows are established, probably within the next three to six weeks.
Position: N/A
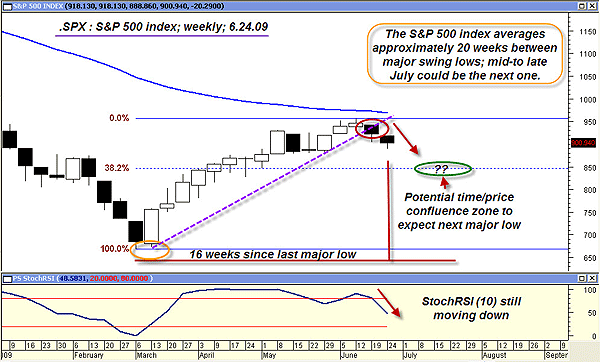
| The broad US markets finally started to break lower this week, which was no surprise to those traders and analysts aware of the cyclical nature of most freely traded markets. In addition, given the seasonality effect that tends to usher in a period of market softness during the summer months, this recent decline was very much to be expected. Similar to the NASDAQ 100 (.NDX, QQQQ) and the Russell 2000 (.RUT, IWM) indexes, the large-cap laden S&P 500 index has yet to complete a weekly 38% retracement of the March to June upswing, providing thoughtful traders with yet another reason to have expected a bit of a pullback before (hopefully) the major uptrend in the broad US markets continue. Let's peer at the weekly graph of the S&P 500 index for more detail (Figure 1). |

|
| FIGURE 1: SPX, WEEKLY. Few things are more dangerous than making market predictions, but the technical clues here seem to imply that the time/price confluence area depicted on the chart could be one in which to expect a reversal to occur. |
| Graphic provided by: MetaStock. |
| |
| If you measure the distance between significant weekly swing lows in the S&P 500 over a large number of measurements, the cycle will average out to about 20 weeks. Sometimes the number will be greater than that, other times it will be less, but at least it provides traders with a "guesstimate" of when the risk will be relatively low in order to initiate long stock positions in the market. The evidence on the chart does seem to suggest that the downward pressure on the index will continue until the Fibonacci 38% retracement is reached, preferably around the anticipated 20-week major swing low. One way to help time all of this is to use an indicator that tends to mimic the major cyclical trend in any given market; one such indicator is the stochRSI (10), plotted at the bottom of the chart. Since breaking a major uptrend line last week, all systems seem to imply that the S&P 500 is definitely on the fast track for a decline to around 850. |
| Once that area of potential support near 850 is reached (even if 20 weeks have passed since the March 2009 weekly swing low), traders will still need to see evidence of an actual turn higher before actually starting to deploy cash into the markets again. Again, using the stochRSI (10) indicator can be a great way to confirm such a turn, given its past accuracy in calling weekly turns in this index, especially when combined with cycle measurements and Fibonacci support/resistance levels. For more bang-for-the-buck excitement at such a high-profile potential turning point, consider focusing on only the strongest relative strength stock sectors and industry groups. |
| The type of basic cycle and support/resistance analysis referred to in this article can also be applied to currencies, commodities, exchange traded funds (ETFs), and individual stocks. It will require some patience to calculate the average distance from swing low to swing low, but the potential rewards may be more than worth the effort. Needless to say, to obtain a statistically valid result, at least 30 calculations (swing low to swing low) -- and preferably many more -- should be utilized; otherwise, the results may not be particularly useful. |
Donald W. Pendergast is a financial markets consultant who offers specialized services to stock brokers and high net worth individuals who seek a better bottom line for their portfolios.
| Title: | Writer, market consultant |
| Company: | Linear Trading Systems LLC |
| Jacksonville, FL 32217 | |
| Phone # for sales: | 904-239-9564 |
| E-mail address: | lineartradingsys@gmail.com |
Traders' Resource Links | |
| Linear Trading Systems LLC has not added any product or service information to TRADERS' RESOURCE. | |
Click here for more information about our publications!
Comments
Date: 06/29/09Rank: 2Comment:

Request Information From Our Sponsors
- StockCharts.com, Inc.
- Candle Patterns
- Candlestick Charting Explained
- Intermarket Technical Analysis
- John Murphy on Chart Analysis
- John Murphy's Chart Pattern Recognition
- John Murphy's Market Message
- MurphyExplainsMarketAnalysis-Intermarket Analysis
- MurphyExplainsMarketAnalysis-Visual Analysis
- StockCharts.com
- Technical Analysis of the Financial Markets
- The Visual Investor
- VectorVest, Inc.
- Executive Premier Workshop
- One-Day Options Course
- OptionsPro
- Retirement Income Workshop
- Sure-Fire Trading Systems (VectorVest, Inc.)
- Trading as a Business Workshop
- VectorVest 7 EOD
- VectorVest 7 RealTime/IntraDay
- VectorVest AutoTester
- VectorVest Educational Services
- VectorVest OnLine
- VectorVest Options Analyzer
- VectorVest ProGraphics v6.0
- VectorVest ProTrader 7
- VectorVest RealTime Derby Tool
- VectorVest Simulator
- VectorVest Variator
- VectorVest Watchdog
