HOT TOPICS LIST
- MACD
- Fibonacci
- RSI
- Gann
- ADXR
- Stochastics
- Volume
- Triangles
- Futures
- Cycles
- Volatility
- ZIGZAG
- MESA
- Retracement
- Aroon
INDICATORS LIST
LIST OF TOPICS
PRINT THIS ARTICLE
by Alan R. Northam
Several methods are used in technical analysis to determine the future direction of the stock market. Among these various methodologies is ratio analysis.
Position: N/A
Alan R. Northam
Alan Northam lives in the Dallas, Texas area and as an electronic engineer gave him an analytical mind from which he has developed a thorough knowledge of stock market technical analysis. His abilities to analyze the future direction of the stock market has allowed him to successfully trade of his own portfolio over the last 30 years. Mr. Northam is now retired and trading the stock market full time. You can reach him at inquiry@tradersclassroom.com or by visiting his website at http://www.tradersclassroom.com. You can also follow him on Twitter @TradersClassrm.
PRINT THIS ARTICLE
REL. STR COMPARATIVE
Ratio Analysis Defines Market Direction
06/24/09 11:32:46 AMby Alan R. Northam
Several methods are used in technical analysis to determine the future direction of the stock market. Among these various methodologies is ratio analysis.
Position: N/A
| In an article entitled "Financial Sector Fuels The S&P 500" (published on 6/16/09), I showed that the future direction of the financial market sector was key to the direction of the overall stock market. However, the financial sector is not the only indicator of the direction of the stock market. Another method is to measure trader and investor confidence in the stock market. One simple way of measuring this is by comparing two key market sectors. This methodology goes by several names, and among them are relative strength comparative analysis, price relative analysis, and ratio analysis. |
| Two market sectors usually competing against each other for investor funds are the consumer discretionary market sector and the consumer staples market sector. The consumer discretionary sector contains stocks that consumers can do without during economic bad times. This sector contains such stocks as Home Depot, Nike, and Target, to name a few, and cable television stocks as well. The consumer staples market sector contains stocks that consumers cannot do without during economic bad times such as Walgreen's, Kraft Foods, and Procter & Gamble. When the economy is expected to do well, consumers are willing to buy products from the consumer discretionary sector and when the economy is expected to do poorly, consumers pull back on spending but will continue to purchase those needed items from the consumer staples market sector. One way to determine if traders and investors have confidence in the future of the economy is to make a comparison of these two market sectors. The way this comparison is usually performed is by using ratio analysis where one market sector is divided by the other. |
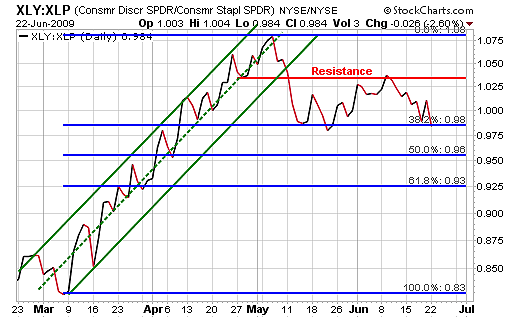
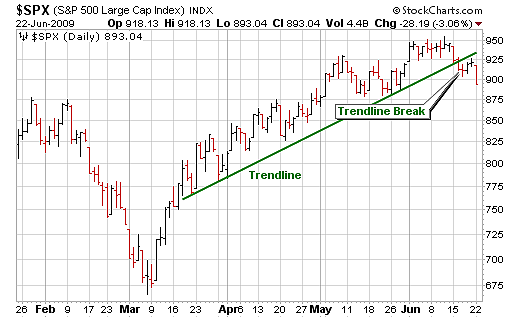
| Figure 1 is the daily line chart of the consumer discretionary market sector divided by the consumer staples market sector. When the ratio line resulting from the division of these two market sectors is rising, that indicates that the consumer discretionary market sector is doing better than the consumer staples market sector and the outlook for the economy and the stock market is good. However, when this ratio line turns down, it is an indication that the consumer discretionary market sector is doing worse than the consumer staples market sector and the outlook for the economy and the stock market is grim. Figure 1 shows that in early March, the ratio line started to move upward, signaling that the future of the economy was improving. As a result, the broader stock market as measured by the S&P 500 started to rally. (Note that the stock market is a leading indicator of the economy.) However, in early May the ratio line broke below its upsloping trading channel, signaling that consumers were now once again becoming concerned about the economy. Since that breakout, the ratio line has been trading in a horizontal trading range between overhead resistance and the 38.2% Fibonacci retracement line. In addition, since early May the S&P 500 has been slowing its advance and has broken down below its own upsloping trendline as shown in Figure 2. |

|
| FIGURE 1: XLY: XLP. This shows the ratio line resulting from dividing the consumer discretionary market sector by the consumer staples sector. |
| Graphic provided by: StockCharts.com. |
| |
| The ratio line that results from dividing the consumer discretionary market sector by the consumer staples market sector can be used to determine the direction of the overall stock market. When this ratio line breaks above a downtrend line, it is a signal that the stock market is ready to move higher. When this ratio line breaks below its upsloping trendline, it is a signal that the stock market is ready to move lower. |

|
| FIGURE 2: $SPX, DAILY. Price bar chart of the S&P 500 showing trendline and trendline break. |
| Graphic provided by: StockCharts.com. |
| |
| In early May, the ratio line broke below its upsloping trading channel (see Figure 1), indicating that traders and investors were becoming worried about the future of the economy. A month later, the S&P 500 broke down below its upsloping trendline (see Figure 2). Note that the breakdown in the ratio line (Figure 1) was a leading indicator of the breakdown in the S&P 500. Currently, the ratio line remains in a horizontal trading range. The key to the future direction of the stock market now depends upon what the ratio line does. If the ratio line continues to move sideways, then the S&P 500 will also move in a sideways direction. If the ratio line starts to move lower, the S&P 500 will most likely move lower as well. However, if the ratio line can manage to break out above its trading range, then the S&P 500 should follow suit and start to move higher again. So besides watching the financial market sector, comparing the consumer discretionary and consumer staples market sectors also holds the key to the future direction of the stock market. |
Alan Northam lives in the Dallas, Texas area and as an electronic engineer gave him an analytical mind from which he has developed a thorough knowledge of stock market technical analysis. His abilities to analyze the future direction of the stock market has allowed him to successfully trade of his own portfolio over the last 30 years. Mr. Northam is now retired and trading the stock market full time. You can reach him at inquiry@tradersclassroom.com or by visiting his website at http://www.tradersclassroom.com. You can also follow him on Twitter @TradersClassrm.
| Garland, Tx | |
| Website: | www.tradersclassroom.com |
| E-mail address: | inquiry@tradersclassroom.com |
Click here for more information about our publications!
Comments
Date: 06/24/09Rank: 5Comment:

Request Information From Our Sponsors
- StockCharts.com, Inc.
- Candle Patterns
- Candlestick Charting Explained
- Intermarket Technical Analysis
- John Murphy on Chart Analysis
- John Murphy's Chart Pattern Recognition
- John Murphy's Market Message
- MurphyExplainsMarketAnalysis-Intermarket Analysis
- MurphyExplainsMarketAnalysis-Visual Analysis
- StockCharts.com
- Technical Analysis of the Financial Markets
- The Visual Investor
- VectorVest, Inc.
- Executive Premier Workshop
- One-Day Options Course
- OptionsPro
- Retirement Income Workshop
- Sure-Fire Trading Systems (VectorVest, Inc.)
- Trading as a Business Workshop
- VectorVest 7 EOD
- VectorVest 7 RealTime/IntraDay
- VectorVest AutoTester
- VectorVest Educational Services
- VectorVest OnLine
- VectorVest Options Analyzer
- VectorVest ProGraphics v6.0
- VectorVest ProTrader 7
- VectorVest RealTime Derby Tool
- VectorVest Simulator
- VectorVest Variator
- VectorVest Watchdog
