HOT TOPICS LIST
- MACD
- Fibonacci
- RSI
- Gann
- ADXR
- Stochastics
- Volume
- Triangles
- Futures
- Cycles
- Volatility
- ZIGZAG
- MESA
- Retracement
- Aroon
INDICATORS LIST
LIST OF TOPICS
PRINT THIS ARTICLE
by Donald W. Pendergast, Jr.
Despite bullish monthly and quarterly price cycles in the Russell 2000 index, the weekly cycles are beginning to exert a minor corrective influence.
Position: N/A
Donald W. Pendergast, Jr.
Donald W. Pendergast is a financial markets consultant who offers specialized services to stock brokers and high net worth individuals who seek a better bottom line for their portfolios.
PRINT THIS ARTICLE
CYCLES
A Month Till A Major Turn For Russell 2000?
06/19/09 10:00:28 AMby Donald W. Pendergast, Jr.
Despite bullish monthly and quarterly price cycles in the Russell 2000 index, the weekly cycles are beginning to exert a minor corrective influence.
Position: N/A
| All three of the widely followed US stock indexes (Russell 2000 [.RUT, IWM], NASDAQ 100 [.NDX, QQQQ], and S&P 500 [.SPX, SPY] indexes) have had astounding gains since early March 2009, when the long-term price cycles (monthly and quarterly) finally bottomed out and began to crank higher. As strong as those cycles (especially the monthly cycle) are right now, the fact remains that cyclical forces also affect the direction of weekly, daily, and intraday prices as well. |

|
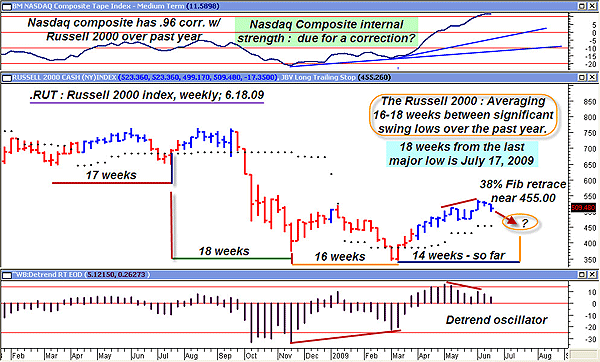
| FIGURE 1: RUT, WEEKLY. Cyclical analysis offers a logical way to anticipate likely turning points. This method works best when combined with an accurate identification of key support/resistance areas. Late July 2009/early August 2009 could be the time for the next major cyclical turn. |
| Graphic provided by: MetaStock. |
| Graphic provided by: WB Detrend EOD from ProfitTrader for MetaStock. |
| |
| Currently, the weekly cycle in the .RUT appears to be on track to make another significant low sometime within the next three to five weeks, all else being equal; looking at Figure 1, we see that it's been 14 weeks since the .RUT made its last major swing low and that the index has also been averaging 16 to 18 weeks between major weekly lows since early 2008. Assuming that this current cycle lasts 18 weeks, that would imply a significant low to be made sometime around July 17, 2009. Of course, making concrete predictions regarding the direction of the stock market can be a risky business, but it's still comforting to know just how reliable past market cycles have been. Now, since the .RUT has yet to complete a full 38% retracement (on a weekly basis) of the move up from the March lows, it may just be that the current downdraft may see the Russell bottom out near 455.00 (the Fibonacci 38% retracement) at the same time that the expected 18-week cycle low is due. |
| At the top of the weekly Russell chart, note how strong the NASDAQ Composite internal strength indicator (a weighted mix of new high/new lows, up volume/down volume, rate of change, and so on) has been. Why the NASDAQ? Because it has a 0.96 correlation with the Russell 2000 over the past year, offering yet another confirmation of the incredible bullish pressures that have been driving all of the broad US markets higher. Even if this particular indicator declines in sync with the price of the indexes, the overall trend is still overwhelmingly bullish, especially once this summer's low is finally made. One reason for that is the fact that the weekly, monthly, and quarterly price cycles of the Russell 2000 will all be aligned in one direction -- up -- possibly allowing for a massive year-end rally to sweep across all of the broad US markets. And since small-cap stocks generally tend to outperform large caps, playing the strongest relative strength stocks from the strongest industry groups could offer the opportunity to make some serious money, once this summer's decline finally plays out. |

|
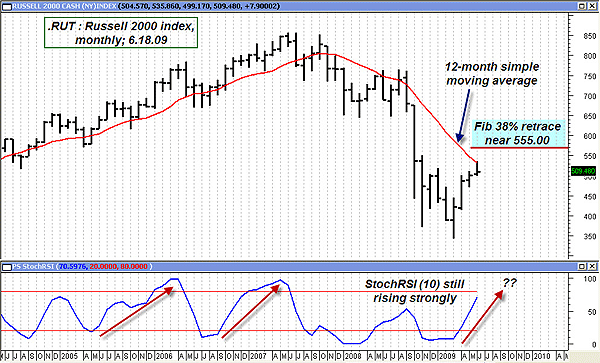
| FIGURE 2: RUT, MONTHLY. Although the long-term bear may still be in force, the action in the stochRSI(10) suggests that further gains may be in store for the Russell 2000 index. |
| Graphic provided by: MetaStock. |
| |
| For further reference, Figure 2 is a monthly chart of the Russell 2000. Although the index is still in a bear market (based on basic swing charting and moving average concepts), note how strong the upward trajectory of the stochRSI (10) indicator is (bottom of chart). The indicator is already higher that it was after last September's feeble rally attempt, and the odds are good that it will make it at least to its upper signal line or beyond, especially if the index completes its weekly cycle low within the next month or so. |
| Perhaps the best advice for traders and investors right now is this: be very selective in your market activities. Only consider short positions for very short-term time frames (60 minutes or lower), and those only on very weak stocks in lagging groups. It might pay to keep some powder dry for the next weekly cycle low, when longer-term positions can be initiated with much less risk than at present. Once the anticipated turn higher happens, aggressively trade your excess funds in the daily and intraday time frames for as long as the weekly and monthly price cycles keep grinding higher. |
Donald W. Pendergast is a financial markets consultant who offers specialized services to stock brokers and high net worth individuals who seek a better bottom line for their portfolios.
| Title: | Writer, market consultant |
| Company: | Linear Trading Systems LLC |
| Jacksonville, FL 32217 | |
| Phone # for sales: | 904-239-9564 |
| E-mail address: | lineartradingsys@gmail.com |
Traders' Resource Links | |
| Linear Trading Systems LLC has not added any product or service information to TRADERS' RESOURCE. | |
Click here for more information about our publications!
Comments
Date: 06/22/09Rank: 2Comment:
Date: 06/23/09Rank: 5Comment:
Date: 06/29/09Rank: 4Comment:

Request Information From Our Sponsors
- StockCharts.com, Inc.
- Candle Patterns
- Candlestick Charting Explained
- Intermarket Technical Analysis
- John Murphy on Chart Analysis
- John Murphy's Chart Pattern Recognition
- John Murphy's Market Message
- MurphyExplainsMarketAnalysis-Intermarket Analysis
- MurphyExplainsMarketAnalysis-Visual Analysis
- StockCharts.com
- Technical Analysis of the Financial Markets
- The Visual Investor
- VectorVest, Inc.
- Executive Premier Workshop
- One-Day Options Course
- OptionsPro
- Retirement Income Workshop
- Sure-Fire Trading Systems (VectorVest, Inc.)
- Trading as a Business Workshop
- VectorVest 7 EOD
- VectorVest 7 RealTime/IntraDay
- VectorVest AutoTester
- VectorVest Educational Services
- VectorVest OnLine
- VectorVest Options Analyzer
- VectorVest ProGraphics v6.0
- VectorVest ProTrader 7
- VectorVest RealTime Derby Tool
- VectorVest Simulator
- VectorVest Variator
- VectorVest Watchdog
