HOT TOPICS LIST
- MACD
- Fibonacci
- RSI
- Gann
- ADXR
- Stochastics
- Volume
- Triangles
- Futures
- Cycles
- Volatility
- ZIGZAG
- MESA
- Retracement
- Aroon
INDICATORS LIST
LIST OF TOPICS
PRINT THIS ARTICLE
by Chaitali Mohile
The Utility Select Sector SPDR has rallied toward its previous highs. Further upward movement seems under threat.
Position: N/A
Chaitali Mohile
Active trader in the Indian stock markets since 2003 and a full-time writer. Trading is largely based upon technical analysis.
PRINT THIS ARTICLE
TECHNICAL ANALYSIS
Utility Select Retraces
06/18/09 02:10:30 PMby Chaitali Mohile
The Utility Select Sector SPDR has rallied toward its previous highs. Further upward movement seems under threat.
Position: N/A
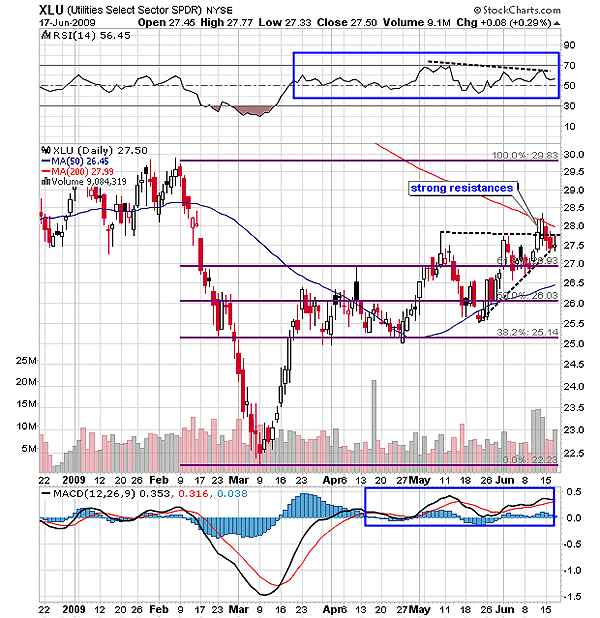
| The Utility Select Sector SPDR (XLU) faced a steep fall from $33 to $22.50 within a month. The declining rally pulled a developed downtrend stronger and rushed to an overheated level. The average directional movement index (ADX) (14) in Figure 1 has hit highly overheated levels at 50. The relative strength index (RSI) (14) slipped in an oversold zone and the moving average convergence/ divergence (MACD) (12,26,9) moved above the trigger line in negative territory. The bearish indicators reversed the descending rally of XLU from the low of $22.50. Earlier, the recovery was faster on higher volume till the 38.2% Fibonacci retracement level was converted to support. |

|
| FIGURE 1: XLU, DAILY. An ascending triangle breakout has retraced due to the 200-day MA resistance and the negative divergence on RSI(14). |
| Graphic provided by: StockCharts.com. |
| |
| In Figure 1, we can see XLU consolidated near the newly formed support of 38.2%. The sideways price action cooled off the highly bearish indicators. The ADX (14) moved below 20, indicating consolidation. Thus, the range-bound rally between 38.2% and 50% retracement level generated an additional bullish strength. The upward trip with the support of the50% level was slow and steady. The horizontal movement of RSI (14) within the 50 and 70 level and the volatile MACD (12,26,9) with support of the zero line controlled price action from the 50% level. Although the triangular formations are commonly found on the technical chart, they should be considered for constructing a trading road map. The black dashed line in Figure 1 shows an ascending triangle formation. |
| The ascending triangle breakout would have pulled XLU to the highest retracement level. Due to the negative divergence of the RSI (14), the breakout is more likely to fail. The descending line (dashed) in the RSI (14) highlights the divergence. In addition, the 200-day moving average (MA) is the major hurdle on the price chart. Although the MACD (12,26,9) is in positive territory, the oscillator shows high volatility. The ADX (14), indicating a developing uptrend, is the only bullish indicator in Figure 1. Therefore, XLU is likely to retrace toward its previous support at $27 and $26. The later support ($26) would be the final support, below which the developing uptrend might reverse. |

|
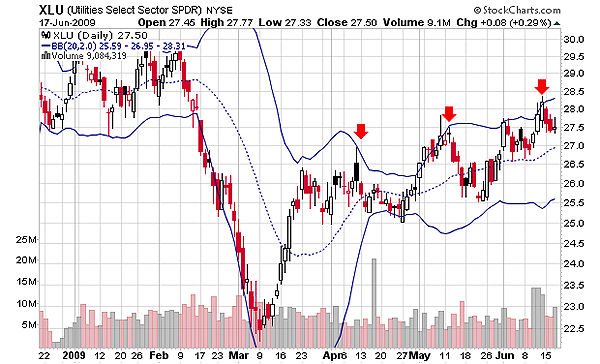
| FIGURE 2: XLU, DAILY. XLU challenged the upper Bollinger band three times, but it failed to break out. Technically, the next rally with the support $27 should breach the upper band resistance. |
| Graphic provided by: StockCharts.com. |
| |
| Due to the 200-day moving average resistance, the negative divergence on RSI (14), and the volatile MACD (12,26,9), XLU failed to surge above an upper Bollinger band as well. The index was ready to break out the upper Bollinger band tool, but weakness on the technical chart retraced the rally. The center line of the tool shows support at $27 in Figure 2. The price has hit the upper Bollinger band three times; therefore, the next bullish rally with the support of $27 would ultimately breach the upper band resistance. Hence, the XLU is likely to retrace toward its technical support. |
| Although XLU is likely to correct currently, the long-term bullishness of the index remains untouched. |
Active trader in the Indian stock markets since 2003 and a full-time writer. Trading is largely based upon technical analysis.
| Company: | Independent |
| Address: | C1/3 Parth Indraprasth Towers. Vastrapur |
| Ahmedabad, Guj 380015 | |
| E-mail address: | chaitalimohile@yahoo.co.in |
Traders' Resource Links | |
| Independent has not added any product or service information to TRADERS' RESOURCE. | |
Click here for more information about our publications!
PRINT THIS ARTICLE

Request Information From Our Sponsors
- StockCharts.com, Inc.
- Candle Patterns
- Candlestick Charting Explained
- Intermarket Technical Analysis
- John Murphy on Chart Analysis
- John Murphy's Chart Pattern Recognition
- John Murphy's Market Message
- MurphyExplainsMarketAnalysis-Intermarket Analysis
- MurphyExplainsMarketAnalysis-Visual Analysis
- StockCharts.com
- Technical Analysis of the Financial Markets
- The Visual Investor
- VectorVest, Inc.
- Executive Premier Workshop
- One-Day Options Course
- OptionsPro
- Retirement Income Workshop
- Sure-Fire Trading Systems (VectorVest, Inc.)
- Trading as a Business Workshop
- VectorVest 7 EOD
- VectorVest 7 RealTime/IntraDay
- VectorVest AutoTester
- VectorVest Educational Services
- VectorVest OnLine
- VectorVest Options Analyzer
- VectorVest ProGraphics v6.0
- VectorVest ProTrader 7
- VectorVest RealTime Derby Tool
- VectorVest Simulator
- VectorVest Variator
- VectorVest Watchdog
