

HOT TOPICS LIST
- MACD
- Fibonacci
- RSI
- Gann
- ADXR
- Stochastics
- Volume
- Triangles
- Futures
- Cycles
- Volatility
- ZIGZAG
- MESA
- Retracement
- Aroon
INDICATORS LIST
LIST OF TOPICS
PRINT THIS ARTICLE
by Donald W. Pendergast, Jr.
Similar to the gold mining industry group, the silver miners are also approaching a key technical and cyclical area.
Position: N/A
Donald W. Pendergast, Jr.
Donald W. Pendergast is a financial markets consultant who offers specialized services to stock brokers and high net worth individuals who seek a better bottom line for their portfolios.
PRINT THIS ARTICLE
MOVING AVERAGES
Silver Miners Approach 200-Day EMA
06/18/09 01:50:26 PMby Donald W. Pendergast, Jr.
Similar to the gold mining industry group, the silver miners are also approaching a key technical and cyclical area.
Position: N/A
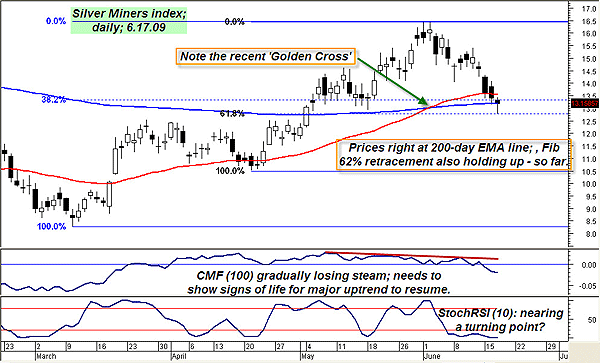
| Just as the gold mining industry stocks enjoyed a massive gain over the past seven months, so also have the major silver mining stocks had a major run. The group represented in Figure 1 is a custom index of silver miners, composed of the following tickers; Pan American Silver (PAAS), Compania De Minas Buenaventura (BVN), Coeur D'Alene Mines Corp. (CDE), Hecla Mining Co., (HL), Mag Silver Corp., (MVG), Silver Standard Resources, Inc., (SSRI), and Silver Wheaton Corp., (SLW). Most of the stocks have excellent liquidity, even though three of them trade at a price of less than $5.00 per share. Examining this group's daily chart reveals several key technical details for those intent on trading this particular niche of the precious metals market. |
|
| FIGURE 1: SILVER MINERS INDEX, DAILY. Long term, the technicals here look very promising for silver bulls. A cross of the stochRSI(10) indicator above its lower signal could also help time a daily swing trade. |
| Graphic provided by: MetaStock. |
| |
| As prices have descended to test the 200-day exponential moving average (EMA), the silver miners index has also encountered a couple of significant Fibonacci retracements from prior swings. So far, prices are staying near the 200-day EMA, a positive technical sign as far as it goes. Many times, stocks (indexes) in a strong bull market will rally higher from the 200-day EMA, but it remains to be seen if these silver miners can muster the strength to do something similar. Meanwhile, the 20-bar average price cycle (measured from swing low to swing low) for the index is due to bottom any time now (currently at 21 bars), even as the stochRSI (10) is extremely oversold. One factor that tips the entire technical equation toward the long-term bullish side of the equation is the recent cross of the 50-day EMA (red line) above the 200-day EMA (blue line), also known as a "golden cross." |
| Obviously, you can't actually trade this index, but you can look at each of its seven component stocks (previously listed) and compare its personal daily price action with the index to see which ones offer the most promising trade setups. The basic requirement for a daily swing trade here is to see the stochRSI(10) indicator turn higher, crossing its lower signal line, especially if the index continues to respect the 200-day EMA -- which also happens to be rising, yet another bullish sign. If you see that drill down to the component stocks and pick the ones with the best set of technicals versus the index. Size your positions wisely, risking perhaps 1% of your account equity on a long swing trade. Setting a stop beneath the most recent swing low and then trailing the position with a three-bar trailing stop of the lows is one way to limit risk and keep any potential gains, should the swing trade setup materialize. |
|
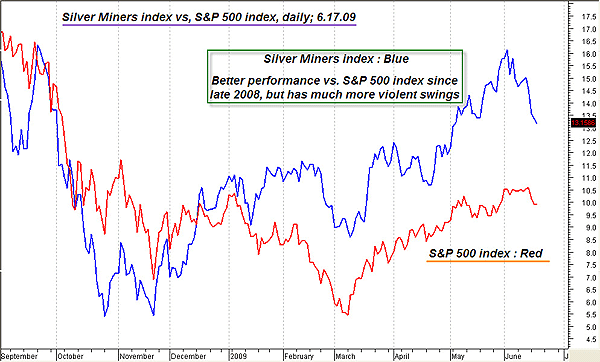
| FIGURE 2: SILVER MINERS INDEX VS. S&P 500, DAILY. The silver miners index plotted against the S&P 500. Silver mining stocks have greatly outperformed large-cap stocks, despite having a penchant for extremely violent price swings. |
| Graphic provided by: MetaStock. |
| |
| Figure 2 is a final look at the daily silver miners index, this time plotted versus the Standard & Poor's 500. Generally speaking, the silver mining stocks have been outperforming the large-cap index by a substantial margin, even though the silver miners have much more volatile price swings, both up and down. Most charting packages offer some kind of chart overlay feature, so make sure you put it to good use when comparing the relative price performance of the stocks, exchange traded funds (ETFs), and commodities you follow. |
Donald W. Pendergast is a financial markets consultant who offers specialized services to stock brokers and high net worth individuals who seek a better bottom line for their portfolios.
| Title: | Writer, market consultant |
| Company: | Linear Trading Systems LLC |
| Jacksonville, FL 32217 | |
| Phone # for sales: | 904-239-9564 |
| E-mail address: | lineartradingsys@gmail.com |
Traders' Resource Links | |
| Linear Trading Systems LLC has not added any product or service information to TRADERS' RESOURCE. | |
Click here for more information about our publications!
Comments
Date:�06/18/09Rank:�5Comment:�

Request Information From Our Sponsors
- StockCharts.com, Inc.
- Candle Patterns
- Candlestick Charting Explained
- Intermarket Technical Analysis
- John Murphy on Chart Analysis
- John Murphy's Chart Pattern Recognition
- John Murphy's Market Message
- MurphyExplainsMarketAnalysis-Intermarket Analysis
- MurphyExplainsMarketAnalysis-Visual Analysis
- StockCharts.com
- Technical Analysis of the Financial Markets
- The Visual Investor
- VectorVest, Inc.
- Executive Premier Workshop
- One-Day Options Course
- OptionsPro
- Retirement Income Workshop
- Sure-Fire Trading Systems (VectorVest, Inc.)
- Trading as a Business Workshop
- VectorVest 7 EOD
- VectorVest 7 RealTime/IntraDay
- VectorVest AutoTester
- VectorVest Educational Services
- VectorVest OnLine
- VectorVest Options Analyzer
- VectorVest ProGraphics v6.0
- VectorVest ProTrader 7
- VectorVest RealTime Derby Tool
- VectorVest Simulator
- VectorVest Variator
- VectorVest Watchdog