HOT TOPICS LIST
- MACD
- Fibonacci
- RSI
- Gann
- ADXR
- Stochastics
- Volume
- Triangles
- Futures
- Cycles
- Volatility
- ZIGZAG
- MESA
- Retracement
- Aroon
INDICATORS LIST
LIST OF TOPICS
PRINT THIS ARTICLE
by Koos van der Merwe
Receiving a buy signal for Cache Inc. -- is this a sign of recovery?
Position: Accumulate
Koos van der Merwe
Has been a technical analyst since 1969, and has worked as a futures and options trader with First Financial Futures in Johannesburg, South Africa.
PRINT THIS ARTICLE
CUP WITH HANDLE
A Buy Signal For Cache Inc.?
06/18/09 08:39:01 AMby Koos van der Merwe
Receiving a buy signal for Cache Inc. -- is this a sign of recovery?
Position: Accumulate
| Cache Inc.'s principal activity is operating chains of women's apparel specialty stores and an online e-commerce website that markets women's apparel and accessories. As of December 31, 2008, the group operated 296 Cache and Cache Luxe stores in 43 states, Puerto Rico, and the US Virgin Islands. |

|
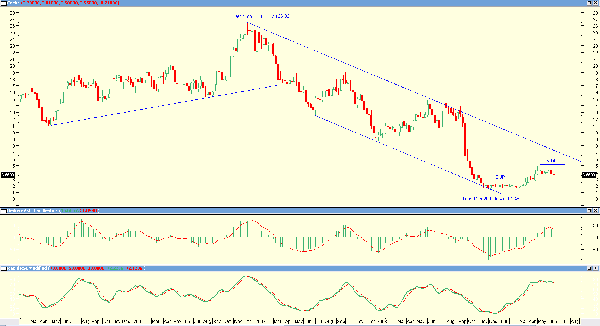
| FIGURE 1: CACHE, INC., WEEKLY |
| Graphic provided by: MetaStock. |
| |
| Figure 1 is a weekly chart, and shows that Cache Inc. topped out on December 15, 2006, at $26.32, long before the market meltdown and the start of the present recession. After a series of recovery waves, the price appears to have found a bottom of $1.45 in December 2008. The chart appears to have formed a cup-with-handle formation, with a buy signal should the price break $5.14. Both the heikin-ashi candlestick and the rapid RSI modified indicators have not confirmed a buy signal and are still in sell mode. |

|
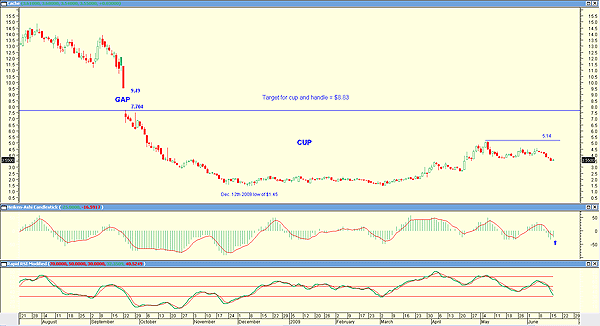
| FIGURE 3: CACHE, INC., DAILY |
| Graphic provided by: MetaStock. |
| |
| Figure 2 shows a slightly different picture. The cup-with-handle formation can be clearly seen, and a move above $5.14 will trigger a buy signal with a target of $8.83 (5.14 - 1.45 = 3.69 + 5.14 = 8.83). The chart also shows a gap between $9.49 and $7.04. This means that the price could rise to fill the gap, confirming the suggested target of $8.83 as a strong possibility. The heikin-ashi candlestick indicator is close to giving a buy signal at present levels. This is confirmed by the rapid RSI modified indicator, which is nearing an oversold level. So is the chart of Cache Inc. telling us that the recession is over? Is the chart of Cache Inc. a leading indicator that the market has definitely turned bull, and that the present movement in the NASDAQ is simply a correction? The stock definitely bears watching. |
Has been a technical analyst since 1969, and has worked as a futures and options trader with First Financial Futures in Johannesburg, South Africa.
| Address: | 3256 West 24th Ave |
| Vancouver, BC | |
| Phone # for sales: | 6042634214 |
| E-mail address: | petroosp@gmail.com |
Click here for more information about our publications!
Comments
Date: 06/18/09Rank: 5Comment:

|

Request Information From Our Sponsors
- StockCharts.com, Inc.
- Candle Patterns
- Candlestick Charting Explained
- Intermarket Technical Analysis
- John Murphy on Chart Analysis
- John Murphy's Chart Pattern Recognition
- John Murphy's Market Message
- MurphyExplainsMarketAnalysis-Intermarket Analysis
- MurphyExplainsMarketAnalysis-Visual Analysis
- StockCharts.com
- Technical Analysis of the Financial Markets
- The Visual Investor
- VectorVest, Inc.
- Executive Premier Workshop
- One-Day Options Course
- OptionsPro
- Retirement Income Workshop
- Sure-Fire Trading Systems (VectorVest, Inc.)
- Trading as a Business Workshop
- VectorVest 7 EOD
- VectorVest 7 RealTime/IntraDay
- VectorVest AutoTester
- VectorVest Educational Services
- VectorVest OnLine
- VectorVest Options Analyzer
- VectorVest ProGraphics v6.0
- VectorVest ProTrader 7
- VectorVest RealTime Derby Tool
- VectorVest Simulator
- VectorVest Variator
- VectorVest Watchdog
