HOT TOPICS LIST
- MACD
- Fibonacci
- RSI
- Gann
- ADXR
- Stochastics
- Volume
- Triangles
- Futures
- Cycles
- Volatility
- ZIGZAG
- MESA
- Retracement
- Aroon
INDICATORS LIST
LIST OF TOPICS
PRINT THIS ARTICLE
by Austin Passamonte
Index option traders watch for certain repeatable patterns that develop several times a year to offer extremely high-odds for success. Monitoring market volatility and trading the turn in human emotion can be lucrative indeed.
Position: N/A
Austin Passamonte
Austin is a private trader who trades emini stock index futures intraday. He currently trades various futures markets from home in addition to managing a trader's educational forum
PRINT THIS ARTICLE
INDEX OPTION TRADING
Extreme VIX = S&P Profits
09/05/01 05:37:28 PMby Austin Passamonte
Index option traders watch for certain repeatable patterns that develop several times a year to offer extremely high-odds for success. Monitoring market volatility and trading the turn in human emotion can be lucrative indeed.
Position: N/A
| The Chicago Board of Options Exchange (CBOE) Volatility Index, or VIX is a quantified measure of investor complacency or fear. Based upon calculated demand for S&P 100 (OEX) index option call or put contracts, it is a synthetic blend of relative option values that moves lower when call options are in demand and moves higher when put options are in demand. |
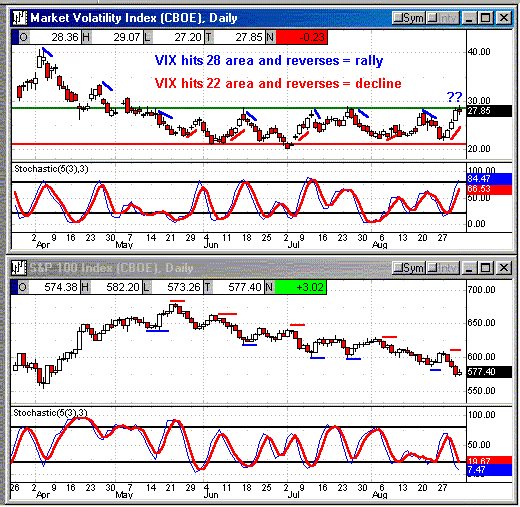
| In other words, the VIX trends down toward an index value of 20 when traders are buying calls or selling puts which indicates a bullish bias in the market. By the same token, the VIX trends to an index value of 30 or beyond when traders are buying puts or selling calls to indicate bearish bias. Used as a contrarian indicator, markets tend to post bullish reversals when fear and the VIX are high while bearish reversals emerge when fear and VIX levels are low. Index values of 20 and 30 have been historical marks of sentiment reversal over the past few years. We have seen the VIX measure below 20 for extended periods of time and likewise spike much higher than 30 during times of excessive fear. However, once VIX levels break below the 22 area or above the 28 area and reverse the other direction from there, market action almost always follows. |

|
| Figure 1: Daily Charts: Chicago Board of Options Exchange (CBOE) Volatility Index, or VIX, and S&P 100 (OEX) index. |
| Graphic provided by: Quote.com. |
| Graphic provided by: QCharts. |
| |
| As we can clearly see for ourselves, each time this year the VIX (top chart) has broken above 28 or below 22 and turned from there, so did the OEX. The Dow, SPX and NDX all move quite closely with this measure in that respective order as well. A sudden move down below 28 for the VIX or spike higher and reversal from there may signal the next near-term bottom has arrived. Some market pundits claim the VIX is less reliable now than in the past because institutional traders favor the SPX over OEX option market where mostly retail or public traders reside. But that is precisely what we want to see in a contrarian indicator: public sentiment at one overwhelming extreme that clearly warns us of a market reversal ahead! Let's see what happens when the VIX inevitably falls back from current levels near 28 area in the coming sessions ahead. |
Austin is a private trader who trades emini stock index futures intraday. He currently trades various futures markets from home in addition to managing a trader's educational forum
| Title: | Individual Trader |
| Company: | CoiledMarkets.com |
| Address: | PO Box 633 |
| Naples, NY 14512 | |
| Website: | coiledmarkets.com/blog |
| E-mail address: | austinp44@yahoo.com |
Traders' Resource Links | |
| CoiledMarkets.com has not added any product or service information to TRADERS' RESOURCE. | |
Click here for more information about our publications!
Comments
Date: 09/13/01Rank: 5Comment:
Date: 09/25/01Rank: 4Comment:
Date: 03/22/02Rank: 3Comment: love the vix. have been using it for over a year.

Request Information From Our Sponsors
- StockCharts.com, Inc.
- Candle Patterns
- Candlestick Charting Explained
- Intermarket Technical Analysis
- John Murphy on Chart Analysis
- John Murphy's Chart Pattern Recognition
- John Murphy's Market Message
- MurphyExplainsMarketAnalysis-Intermarket Analysis
- MurphyExplainsMarketAnalysis-Visual Analysis
- StockCharts.com
- Technical Analysis of the Financial Markets
- The Visual Investor
- VectorVest, Inc.
- Executive Premier Workshop
- One-Day Options Course
- OptionsPro
- Retirement Income Workshop
- Sure-Fire Trading Systems (VectorVest, Inc.)
- Trading as a Business Workshop
- VectorVest 7 EOD
- VectorVest 7 RealTime/IntraDay
- VectorVest AutoTester
- VectorVest Educational Services
- VectorVest OnLine
- VectorVest Options Analyzer
- VectorVest ProGraphics v6.0
- VectorVest ProTrader 7
- VectorVest RealTime Derby Tool
- VectorVest Simulator
- VectorVest Variator
- VectorVest Watchdog
