HOT TOPICS LIST
- MACD
- Fibonacci
- RSI
- Gann
- ADXR
- Stochastics
- Volume
- Triangles
- Futures
- Cycles
- Volatility
- ZIGZAG
- MESA
- Retracement
- Aroon
INDICATORS LIST
LIST OF TOPICS
PRINT THIS ARTICLE
by Chaitali Mohile
The long-term bullish reversal pattern waits for the potential breakout.
Position: N/A
Chaitali Mohile
Active trader in the Indian stock markets since 2003 and a full-time writer. Trading is largely based upon technical analysis.
PRINT THIS ARTICLE
ROUND TOP & BOTTOM
Light Crude Oil Index Bullish Or Bearish?
06/17/09 01:48:45 PMby Chaitali Mohile
The long-term bullish reversal pattern waits for the potential breakout.
Position: N/A
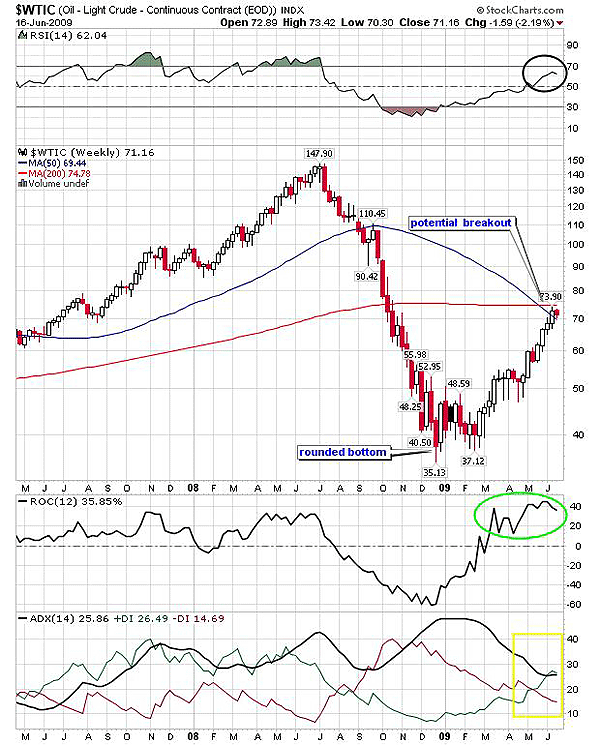
| The large tsunami waves took the light crude oil index ($WTIC) to a new high of $147. Due to a technical correction, $WTIC took a nosedive to a low of $35. The descending rally violated some most important supports (few historical lows) and gradually moved to the low. An oversold relative strength index (RSI) (14) and an overheated downtrend of the average directional movement index (ADX) (14) relieved the bullish traders by initiating a pullback rally. In Figure 1, we can see that the index recovered under a volatile situation. Recently, the index has almost completed its upward move, and therefore, a rounded-bottom pattern is confirmed. You cannot anticipate the pattern formation before it is actually visible on the technical charts. Since the upward move of $WTIC has reached the 200-day moving average (MA) and 50-day moving average (MA) resistance, you can identify the bullish reversal pattern in Figure 1. |
| The potential breakout of the rounded-bottom appears in a bullish direction after violating the MA resistance. In Figure 1, the two strong MA resistances are seen for the bullish pattern. Currently, $WTIC is worth $70, but the breakout above the 200-day MA and the 50-day MA would bring a strong bullish wave, which might freeze many traders. But before measuring any target on the breakout, let us understand if the index is really on an edge to break out or if $WTIC would witness the correction. Both the MAs are major resistance for the bullish breakout, and in addition, the indicators in Figure 1 are not reflecting the bullish strength essential for the upward rally. |

|
| FIGURE 1: $WTIC, WEEKLY. The round-bottom pattern has two strong resistances of the 200-day MA and 50-day MA. The indicators are not fueled with bullish strength essential for the breakout. |
| Graphic provided by: StockCharts.com. |
| |
| The rate of change (ROC) (12) was unsteady while traveling upward. The indicator shows the intensity of the price change of a particular index or the stock in percentage. The unstable vertical move of the ROC (12) shows the bullish price rally is likely to reverse. The RSI (14) is likely to decline from a marginally overbought area, indicating the lack of bullish strength. But I would like to highlight the golden support at the 50 level of the momentum oscillator that might withhold the descending price rally. The ADX (14) is indicating a developing uptrend. Therefore, my interpretation is that $WTIC would consolidate currently but may correct later. The correction would pull down the index to $55. |

|
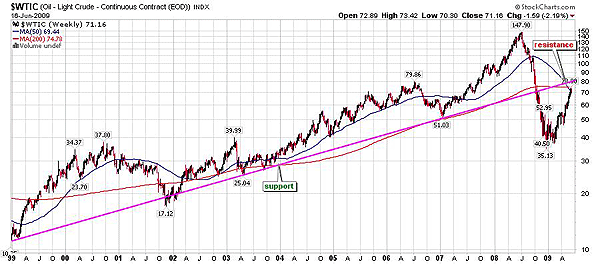
| FIGURE 2: $WTIC, WEEKLY. The chart has 10 years' data. The trendline joining all the lows is the resistance for the bullish rally. |
| Graphic provided by: StockCharts.com. |
| |
| Figure 2 would explain why the correction is anticipated. The weekly chart has 10-year data. The trendline joining all historical lows coincides with the current 200-day and 50-day MA resistance. Therefore, it would be tough for $WTIC to violate the three resistances. This might result in a serious correction. On the contrary; if $WTIC surges above all the three resistances in Figure 2, a robust bullish rally would be initiated. |

|
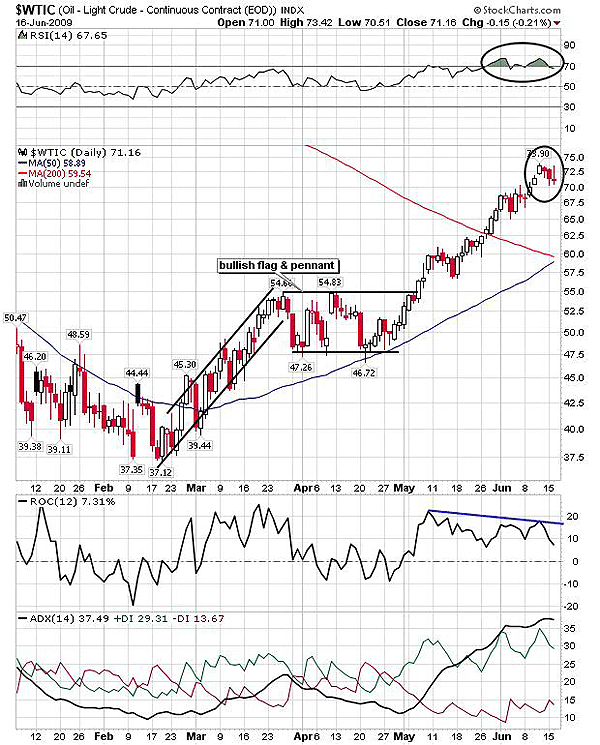
| FIGURE 3: $WTIC, DAILY. The 200-day and 50-day MAs are the important support for $WTIC during the downward rally. |
| Graphic provided by: StockCharts.com. |
| |
| The daily chart in Figure 3 would give short-term trading prospective on the oil index. $WTIC consolidated in April and May, forming a bullish flag and pennant pattern. The minimum estimated level after the breakout above $55 was $73 (55 - 37 = 18 + 55 = $73). In Figure 3, we can see that $WTIC has recently reached its target and turned sideways. The RSI (14) formed a double top in an overbought area. As a result, the indicator may undergo a corrective phase that may spoil the bulls' party. The ROC (12) shows lower highs, indicating a negative divergence. In addition, the uptrend would soon hit overheated levels of the ADX (14) at 40. Thus, Figure 3 suggest volatile consolidation for $WTIC. But the bigger picture of oil index looks bearish for the intermediate period. The rounded-bottom pattern may not breach the MA resistance; instead, it would correct. |
Active trader in the Indian stock markets since 2003 and a full-time writer. Trading is largely based upon technical analysis.
| Company: | Independent |
| Address: | C1/3 Parth Indraprasth Towers. Vastrapur |
| Ahmedabad, Guj 380015 | |
| E-mail address: | chaitalimohile@yahoo.co.in |
Traders' Resource Links | |
| Independent has not added any product or service information to TRADERS' RESOURCE. | |
Click here for more information about our publications!
Comments
Date: 06/17/09Rank: 1Comment:

Request Information From Our Sponsors
- VectorVest, Inc.
- Executive Premier Workshop
- One-Day Options Course
- OptionsPro
- Retirement Income Workshop
- Sure-Fire Trading Systems (VectorVest, Inc.)
- Trading as a Business Workshop
- VectorVest 7 EOD
- VectorVest 7 RealTime/IntraDay
- VectorVest AutoTester
- VectorVest Educational Services
- VectorVest OnLine
- VectorVest Options Analyzer
- VectorVest ProGraphics v6.0
- VectorVest ProTrader 7
- VectorVest RealTime Derby Tool
- VectorVest Simulator
- VectorVest Variator
- VectorVest Watchdog
- StockCharts.com, Inc.
- Candle Patterns
- Candlestick Charting Explained
- Intermarket Technical Analysis
- John Murphy on Chart Analysis
- John Murphy's Chart Pattern Recognition
- John Murphy's Market Message
- MurphyExplainsMarketAnalysis-Intermarket Analysis
- MurphyExplainsMarketAnalysis-Visual Analysis
- StockCharts.com
- Technical Analysis of the Financial Markets
- The Visual Investor
