HOT TOPICS LIST
- MACD
- Fibonacci
- RSI
- Gann
- ADXR
- Stochastics
- Volume
- Triangles
- Futures
- Cycles
- Volatility
- ZIGZAG
- MESA
- Retracement
- Aroon
INDICATORS LIST
LIST OF TOPICS
PRINT THIS ARTICLE
by Ron Walker
The McClellan summation index of the NYSE is diverging with the NYSE Composite. The summation index gave a much earlier crossover signal than many other trend-based indicators such as the MACD, giving some advance warnings of an upcoming reversal.
Position: N/A
Ron Walker
Ron Walker is an active trader and technical analyst. He operates an educational website dedicated to the study of Technical Analysis. The website offers free market analysis with daily video presentations and written commentaries. Ron is a video pioneer, being one of the first to utilize the internet producing Technical Analysis videos. His website is thechartpatterntrader.com
PRINT THIS ARTICLE
MCCLELLAN SUMM INDEX
The NYSE Summation Index Suggests A Summer Selloff
06/17/09 01:36:37 PMby Ron Walker
The McClellan summation index of the NYSE is diverging with the NYSE Composite. The summation index gave a much earlier crossover signal than many other trend-based indicators such as the MACD, giving some advance warnings of an upcoming reversal.
Position: N/A
| The McClellan summation index is a cumulative sum of the daily McClellan oscillator figures. In short, the McClellan oscillator takes the difference between two exponential moving averages (EMAs) of the daily NYSE advance-decline values. The McClellan oscillator (MO) is the difference between the 19-day and the 39-day EMAs of the daily net advance-decline figures. The MO is a market breadth indicator that helps us evaluate the money flow of the stock market. Its purpose is to help determine if money is entering or exiting the stock market, indicating whether overbought or oversold conditions are present. The formula is simple: McClellan oscillator = (19-day EMA advances minus declines) - (39-day EMA of advances minus declines) |

|
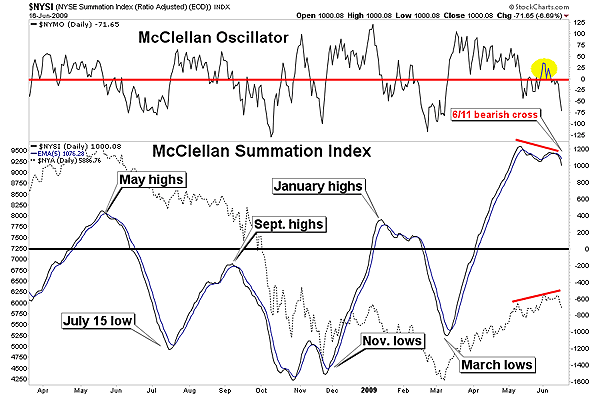
| FIGURE 1: MCCLELLAN OSCILLATOR & MCCLELLAN SUMMATION INDEX FOR THE NYSE.The two-week rally in June was very choppy and was marked as a bogus breakout by the McClellan oscillator and summation index. Note how the MO quickly retreated back below the zero line after a brief encounter into positive territory (highlighted in yellow), while the summation index crossed below the five-day EMA. |
| Graphic provided by: StockCharts.com. |
| |
| The McClellan summation index (MSI) is calculated by adding each day's McClellan oscillator to the previous day's summation index. The MO is plotted vertically and fluctuates between +100 and -100, with zero acting as a median line. When the indicator is above zero it is a favorable environment for long positions, but when the oscillator hovers below zero it signals that it is a better atmosphere for selling short (see Figure 1). The MSI also fluctuates between positive and negative territory with a median line of zero. A move below zero is undesirable and suggests price weakness. The MSI is better suited for longer position or trend trades, whereas the MO is ideal for the day- and swing trader providing short-term signals. |
| In Figure 1, both the MO and MSI are charted. Personally, I have found by adding a five-day EMA to the MSI, that excellent buy and sell signals can be generated. Buy and sell signals are triggered as the MSI crosses above and below the five-day EMA. Divergences also take place between the MSI and the NYSE, offering forewarnings to an impending reversal. Looking at Figure 1 closely, we can see that the recent rally that took place in the first two weeks of June caused the MO to move above zero momentarily. However, the move was unsustainable and quickly reversed as the oscillator moved back below the zero line as prices began crashing down through key levels of support on most indexes. |

|
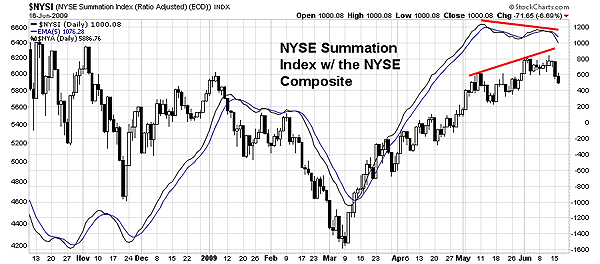
| FIGURE 2: MCCLELLAN SUMMATION INDEX FOR THE NYSE, DAILY. Here, the McClellan summation index of the NYSE is diverging with the NYSE Composite. Prices rose to new highs on the NYSE, but the MSI failed to follow. This clearly shows profit-taking and money leaving the stock market. |
| Graphic provided by: StockCharts.com. |
| |
| The New York Stock Exchange (NYSE) Composite ($NYA) is a stock market index that covers all common stock listed on the NYSE. In Figure 2, the summation index is plotted behind the NYSE Composite for a quick comparison. Note that the MSI is diverging with the NYSE Composite. NYSE made higher highs but the summation index made a lower high and then crossed below its five-day EMA. This divergence suggests that a corrective move will likely transpire throughout the summer months, bringing about an overdue correction. Take a look at the two previous buy signals that were given shortly after the November 21, 2008, and the March 6, 2009, lows (Figure 1). In both cases the summation index gave timely entry points. It also predicted the January 2009 peak with uncanny accuracy, providing a good sell signal. More recently, it triggered a sell signal in May, but the sell signal proved to be short-lived in order for the bearish divergence to form. |
| Incidentally, the last sell signal that was generated on MSI was given on June 10, 2009. It wasn't until three trading sessions later, on June 15, 2009, that the moving average convergence divergence (MACD) gave its sell signal on the NYSE Composite. The MSI gave an accurate assessment of current market conditions, in spite of bullish opposition. By utilizing the MSI, you will improve your trading skills by taking a lot of the guessing out of your investment decisions. You will get more accurate and predictable results of directional moves by using this efficient price apparatus. |
Ron Walker is an active trader and technical analyst. He operates an educational website dedicated to the study of Technical Analysis. The website offers free market analysis with daily video presentations and written commentaries. Ron is a video pioneer, being one of the first to utilize the internet producing Technical Analysis videos. His website is thechartpatterntrader.com
| Website: | thechartpatterntrader.com |
| E-mail address: | thechartpatterntrader@gmail.com |
Click here for more information about our publications!
Comments
Date: 06/17/09Rank: 5Comment:
Date: 06/30/09Rank: 5Comment:
Date: 06/30/09Rank: 5Comment:

|

Request Information From Our Sponsors
- StockCharts.com, Inc.
- Candle Patterns
- Candlestick Charting Explained
- Intermarket Technical Analysis
- John Murphy on Chart Analysis
- John Murphy's Chart Pattern Recognition
- John Murphy's Market Message
- MurphyExplainsMarketAnalysis-Intermarket Analysis
- MurphyExplainsMarketAnalysis-Visual Analysis
- StockCharts.com
- Technical Analysis of the Financial Markets
- The Visual Investor
- VectorVest, Inc.
- Executive Premier Workshop
- One-Day Options Course
- OptionsPro
- Retirement Income Workshop
- Sure-Fire Trading Systems (VectorVest, Inc.)
- Trading as a Business Workshop
- VectorVest 7 EOD
- VectorVest 7 RealTime/IntraDay
- VectorVest AutoTester
- VectorVest Educational Services
- VectorVest OnLine
- VectorVest Options Analyzer
- VectorVest ProGraphics v6.0
- VectorVest ProTrader 7
- VectorVest RealTime Derby Tool
- VectorVest Simulator
- VectorVest Variator
- VectorVest Watchdog
