HOT TOPICS LIST
- MACD
- Fibonacci
- RSI
- Gann
- ADXR
- Stochastics
- Volume
- Triangles
- Futures
- Cycles
- Volatility
- ZIGZAG
- MESA
- Retracement
- Aroon
INDICATORS LIST
LIST OF TOPICS
PRINT THIS ARTICLE
by Alan R. Northam
The S&P 500 has now run up against key resistance and cannot seem to break through to continue its advance. The financial market sector is the fuel for the S&P 500. Has the S&P 500 run out of fuel?
Position: N/A
Alan R. Northam
Alan Northam lives in the Dallas, Texas area and as an electronic engineer gave him an analytical mind from which he has developed a thorough knowledge of stock market technical analysis. His abilities to analyze the future direction of the stock market has allowed him to successfully trade of his own portfolio over the last 30 years. Mr. Northam is now retired and trading the stock market full time. You can reach him at inquiry@tradersclassroom.com or by visiting his website at http://www.tradersclassroom.com. You can also follow him on Twitter @TradersClassrm.
PRINT THIS ARTICLE
TECHNICAL ANALYSIS
Financial Sector Fuels The S&P 500
06/16/09 10:01:46 AMby Alan R. Northam
The S&P 500 has now run up against key resistance and cannot seem to break through to continue its advance. The financial market sector is the fuel for the S&P 500. Has the S&P 500 run out of fuel?
Position: N/A
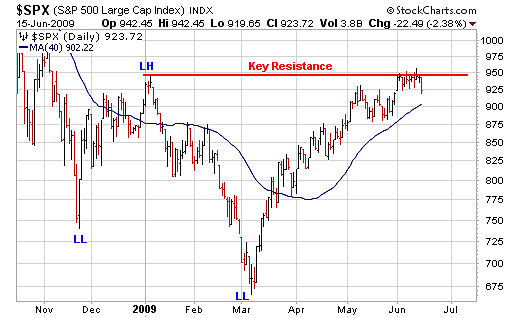
| The Standard & Poor's 500 (Figure 1) has been moving higher since early March but ran up against key resistance at the end of May and has been fighting to break through this line or resistance during June. Key resistance is a price level that if traded through signals a change in trend. Ever since October 2007 the S&P 500 has been moving downward making a series of lower peaks and lower troughs signaling a downward trend. If the S&P 500 can now break above key resistance, it will break the series of lower peaks and troughs by forming a higher peak. This higher peak then signals the end of the downward trend and the beginning of a new upward trend. Technically, the S&P 500 has already formed a new higher peak ending the old downward trend and ushering in a new trend. (See my article entitled "S&P 500 Breaks Series Of Peaks And Troughs" published on 06/08/09.) |

|
| FIGURE 1: S&P 500, DAILY. See the key resistance line drawn off the early January 2009 price peak. |
| Graphic provided by: StockCharts.com. |
| |
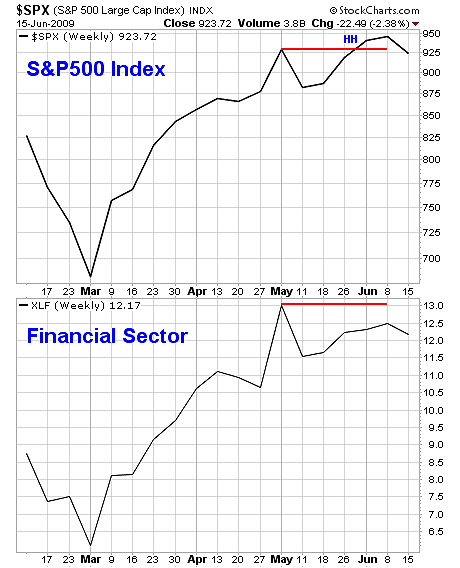
| One of the reasons why the S&P 500 may be finding it difficult to break out above the key resistance line is the lack of follow-through by the financial sector. Figure 2 shows that both the S&P 500 and the financial sector bottomed at the end of February and moved upward in lock-step fashion until mid-May. In late May, the S&P 500 made a higher high by closing above the the peak made at the end of April, whereas the financial sector did not. This lack of follow-through by the financial sector forms a bearish divergence between the S&P 500 and the financial sector. The financial sector is the fuel that pushes the stock market higher ,and when the stock market runs out of fuel, it is bound to slow down and easily reverse direction. It's like a car that runs out of gas suddenly. For a while, the car will keep moving forward but eventually come to a stop. The stock market is like the car. When it runs out of fuel, it will stop moving higher, and when it cannot move higher, it will reverse direction and start to fall. Since the beginning of May, the stock market has run out of fuel and is coasting on its own. It is now at the point where it has slowed to the point where it is in the process of turning lower. What the stock market needs now is a boost of fuel by the financial sector breaking above its early May peak to reenergize the stock market. |

|
| FIGURE 2: S&P 500, FINANCIAL SECTOR, WEEKLY. The S&P 500 has made a new higher high price since early May, whereas the financial sector has not. This provides a bearish divergence signal to the overall stock market. |
| Graphic provided by: StockCharts.com. |
| |
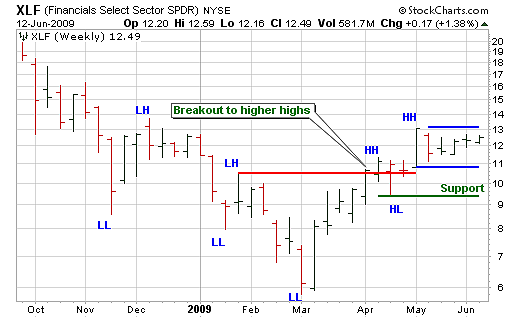
| The key to whether the S&P 500 continues to rally higher from current levels resides in the financial market sector. Figure 3 shows my technical analysis of the financial market sector based upon the weekly bar chart. Note that since the March low, XLF has been moving upward in a series of higher highs (marked HH on the chart) and higher lows (marked HL). An upward trend is defined as a series of waves that make higher highs and higher lows. Since XLF has been making a series of higher highs and higher lows, it is in an established upward trend. However, note that XLF has not made a new higher high for the last five weeks and has been trading in a range between the high and low of the weekly bar made at the beginning of May. This puts the financial market sector in a consolidation trading range. Consolidation patterns are normally continuation patterns. Therefore, since the market is in an established upward trend and has been consolidating over the past five weeks, XLF should eventually continue higher. |

|
| FIGURE 3: XLF, WEEKLY. This chart shows that the financial sector continues to make higher highs and higher lows, signaling that the upward trend is still intact. This chart also shows that the financial sector is currently in a consolidation pattern. Consolidation patterns are typically continuation patterns that signal the continuation of the upward trend but can be reversal signals. |
| Graphic provided by: StockCharts.com. |
| |
| As long as the financial market sector does not break its series of forming higher highs and higher lows, the upward trend will continue. Once the consolidation phase of the financial sector is completed and XLF breaks out to the upside, it should provide the fuel to push the S&P 500 higher. However, should XLF fall below the support line just above $9.00 per share, it will break the series of higher lows and signal a trend reversal. If this occurs, then the S&P 500 will most likely reverse its upward trend. The key to watch is the financial market sector. |
Alan Northam lives in the Dallas, Texas area and as an electronic engineer gave him an analytical mind from which he has developed a thorough knowledge of stock market technical analysis. His abilities to analyze the future direction of the stock market has allowed him to successfully trade of his own portfolio over the last 30 years. Mr. Northam is now retired and trading the stock market full time. You can reach him at inquiry@tradersclassroom.com or by visiting his website at http://www.tradersclassroom.com. You can also follow him on Twitter @TradersClassrm.
| Garland, Tx | |
| Website: | www.tradersclassroom.com |
| E-mail address: | inquiry@tradersclassroom.com |
Click here for more information about our publications!
Comments
Date: 06/16/09Rank: 5Comment:

Request Information From Our Sponsors
- StockCharts.com, Inc.
- Candle Patterns
- Candlestick Charting Explained
- Intermarket Technical Analysis
- John Murphy on Chart Analysis
- John Murphy's Chart Pattern Recognition
- John Murphy's Market Message
- MurphyExplainsMarketAnalysis-Intermarket Analysis
- MurphyExplainsMarketAnalysis-Visual Analysis
- StockCharts.com
- Technical Analysis of the Financial Markets
- The Visual Investor
- VectorVest, Inc.
- Executive Premier Workshop
- One-Day Options Course
- OptionsPro
- Retirement Income Workshop
- Sure-Fire Trading Systems (VectorVest, Inc.)
- Trading as a Business Workshop
- VectorVest 7 EOD
- VectorVest 7 RealTime/IntraDay
- VectorVest AutoTester
- VectorVest Educational Services
- VectorVest OnLine
- VectorVest Options Analyzer
- VectorVest ProGraphics v6.0
- VectorVest ProTrader 7
- VectorVest RealTime Derby Tool
- VectorVest Simulator
- VectorVest Variator
- VectorVest Watchdog
