HOT TOPICS LIST
- MACD
- Fibonacci
- RSI
- Gann
- ADXR
- Stochastics
- Volume
- Triangles
- Futures
- Cycles
- Volatility
- ZIGZAG
- MESA
- Retracement
- Aroon
INDICATORS LIST
LIST OF TOPICS
PRINT THIS ARTICLE
by Donald W. Pendergast, Jr.
Despite today's selloff in the broad US markets, Amazon shares managed to produce a potentially significant, bullish reversal bar.
Position: Buy
Donald W. Pendergast, Jr.
Donald W. Pendergast is a financial markets consultant who offers specialized services to stock brokers and high net worth individuals who seek a better bottom line for their portfolios.
PRINT THIS ARTICLE
CYCLES
Is The Amazon.com Cyclical Turn At Hand?
06/16/09 09:38:03 AMby Donald W. Pendergast, Jr.
Despite today's selloff in the broad US markets, Amazon shares managed to produce a potentially significant, bullish reversal bar.
Position: Buy
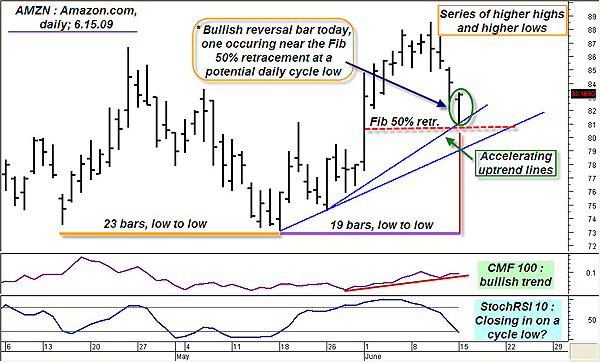
| Amazon.com (AMZN) has been in a major uptrend since making a major low in November 2008. The stock has only had two significant corrective moves (January 2009 and April/May 2009) since that time, recovering a large portion of its bear market losses in the process. Today, after a week-long retracement, AMZN began to sell off with the rest of the market before managing to print a very bullish-looking reversal bar (closing near the high of the day, no less). AMZN's daily chart provides us with many helpful clues as we attempt to ascertain the technical state of this online retail giant's stock. See Figure 1. |

|
| FIGURE 1: AMZN, DAILY. A possible low-risk long swing trade setup in AMZN. A buy-stop entry near $83.30 is perhaps the simplest way to get into this anticipated bullish swing move. |
| Graphic provided by: MetaStock. |
| |
| There is no shortage of bullish technicals here on the daily view of AMZN; in no particular order, here are the main features of interest to those looking to latch on to a long swing trade entry: * Accelerating uptrend lines * Bullish long-term Chaikin money flow (CMF)(100) * Higher highs and higher lows * The reversal occurred right near the 50% Fibonacci retracement, close to the anticipated time that the stock's 17- to 22-day price cycle is expected to bottom out. Strong stocks tend to stay strong, and given the weight of the current technical evidence, going long on a breach above today's high near $83.30 might not be a bad idea at all, especially if similarly correlated stocks are also rising in sympathy, stocks such as PMCS, DFT, MIPS, SWKS, SY, and AN. Each of these stocks has a six-month correlation ranging from 0.95 to 0.97 versus AMZN, so if most of these are also breaking higher as AMZN approaches $83.30, it would seem to be a great long entry confirmation. Interestingly, AMZN's six-month correlation against the QQQQ (NASDAQ 100 index ETF) is only 0.79, while its correlation versus the SPY (S&P 500 index ETF) comes in at only 0.27. If you see all three of these ETFs rising as well, that would be even more positive confirmation for those wanting to pull the trigger on a long Amazon.com trade. |
| Managing such a trade is relatively straightforward; if the buy-stop near $83.30 is filled, place an initial stop a few ticks below $81 (today's low) and then run a two- to three-bar trail of the lows as a trailing stop. If the stock gets close to the recent swing high of $88.56 before stopping out, consider taking half (if not all) of the position off, being thankful for such a swing move higher. Simply let the trailing stop take you out of the balance of the position after taking some profits near that important daily swing high. |
| While this looks like an attractive daily swing trade setup, longer term, a more sizable corrective move in AMZN wouldn't be a surprise at all, given the magnitude of the run since last year. In addition, there is major weekly resistance near $91.75, something all current AMZN shareholders should be aware of. |
Donald W. Pendergast is a financial markets consultant who offers specialized services to stock brokers and high net worth individuals who seek a better bottom line for their portfolios.
| Title: | Writer, market consultant |
| Company: | Linear Trading Systems LLC |
| Jacksonville, FL 32217 | |
| Phone # for sales: | 904-239-9564 |
| E-mail address: | lineartradingsys@gmail.com |
Traders' Resource Links | |
| Linear Trading Systems LLC has not added any product or service information to TRADERS' RESOURCE. | |
Click here for more information about our publications!
Comments
Date: 06/16/09Rank: 3Comment:

Request Information From Our Sponsors
- StockCharts.com, Inc.
- Candle Patterns
- Candlestick Charting Explained
- Intermarket Technical Analysis
- John Murphy on Chart Analysis
- John Murphy's Chart Pattern Recognition
- John Murphy's Market Message
- MurphyExplainsMarketAnalysis-Intermarket Analysis
- MurphyExplainsMarketAnalysis-Visual Analysis
- StockCharts.com
- Technical Analysis of the Financial Markets
- The Visual Investor
- VectorVest, Inc.
- Executive Premier Workshop
- One-Day Options Course
- OptionsPro
- Retirement Income Workshop
- Sure-Fire Trading Systems (VectorVest, Inc.)
- Trading as a Business Workshop
- VectorVest 7 EOD
- VectorVest 7 RealTime/IntraDay
- VectorVest AutoTester
- VectorVest Educational Services
- VectorVest OnLine
- VectorVest Options Analyzer
- VectorVest ProGraphics v6.0
- VectorVest ProTrader 7
- VectorVest RealTime Derby Tool
- VectorVest Simulator
- VectorVest Variator
- VectorVest Watchdog
