HOT TOPICS LIST
- MACD
- Fibonacci
- RSI
- Gann
- ADXR
- Stochastics
- Volume
- Triangles
- Futures
- Cycles
- Volatility
- ZIGZAG
- MESA
- Retracement
- Aroon
INDICATORS LIST
LIST OF TOPICS
PRINT THIS ARTICLE
by Mike Carr, CMT
Monthly charts are rarely analyzed in today's daytrading environment, but monthly signals are rare and reliable.
Position: N/A
Mike Carr, CMT
Mike Carr, CMT, is a member of the Market Technicians Association, and editor of the MTA's newsletter, Technically Speaking. He is also the author of "Smarter Investing in Any Economy: The Definitive Guide to Relative Strength Investing," and "Conquering the Divide: How to Use Economic Indicators to Catch Stock Market Trends."
PRINT THIS ARTICLE
RSI
RSI Points Toward New Bull
06/15/09 09:32:10 AMby Mike Carr, CMT
Monthly charts are rarely analyzed in today's daytrading environment, but monthly signals are rare and reliable.
Position: N/A
| J. Welles Wilder's relative strength index (RSI) is a widely followed technical indicator. A favorite of short-term traders, RSI provides overbought and oversold signals. Buy signals occur after RSI becomes oversold and drops below 30. When the indicator crosses back above 30, a buy is entered. Sell signals occur when RSI falls below 70 after rising above this level, which is considered to be overbought. |
| These simple signals do not lead to spectacular profits on daily charts. Backtesting usually finds this is among the best oscillators, but prudent traders find that risk outweighs the potential rewards. However, on a monthly chart, the signals are rare, and seem to be very accurate. |
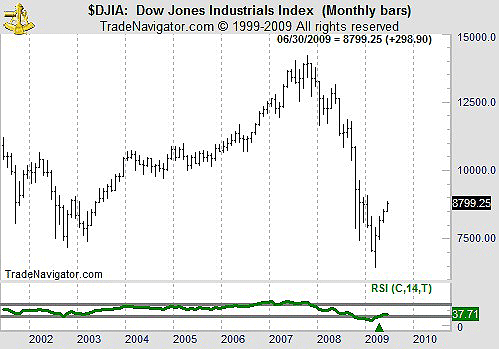
| At the end of April 2009, on the chart of the Dow Jones Industrial Average (DJIA), RSI crossed above 30 after being oversold for six months (Figure 1). |

|
| FIGURE 1: DJIA, MONTHLY. For the fourth time in more than 100 years, RSI gave a buy signal. |
| Graphic provided by: Trade Navigator. |
| |
| The historical record shows only three other times when RSI fell below 30 on the monthly chart for at least two months. It offered buy signals in October 1974, August 1932, and September 1921. While the bear market bottoms of 1974 and 1929 are well known, 1921 is not as well known. The DJIA reached a low point of 63.90 in 1921 after peaking at 119.62 in 1919. In a two-year bear market, the DJIA experienced a 47% decline. |
| According to the RSI, we may have seen a historical low in the market. |
Mike Carr, CMT, is a member of the Market Technicians Association, and editor of the MTA's newsletter, Technically Speaking. He is also the author of "Smarter Investing in Any Economy: The Definitive Guide to Relative Strength Investing," and "Conquering the Divide: How to Use Economic Indicators to Catch Stock Market Trends."
| Website: | www.moneynews.com/blogs/MichaelCarr/id-73 |
| E-mail address: | marketstrategist@gmail.com |
Click here for more information about our publications!
Comments
Date: 06/23/09Rank: 5Comment:

Request Information From Our Sponsors
- StockCharts.com, Inc.
- Candle Patterns
- Candlestick Charting Explained
- Intermarket Technical Analysis
- John Murphy on Chart Analysis
- John Murphy's Chart Pattern Recognition
- John Murphy's Market Message
- MurphyExplainsMarketAnalysis-Intermarket Analysis
- MurphyExplainsMarketAnalysis-Visual Analysis
- StockCharts.com
- Technical Analysis of the Financial Markets
- The Visual Investor
- VectorVest, Inc.
- Executive Premier Workshop
- One-Day Options Course
- OptionsPro
- Retirement Income Workshop
- Sure-Fire Trading Systems (VectorVest, Inc.)
- Trading as a Business Workshop
- VectorVest 7 EOD
- VectorVest 7 RealTime/IntraDay
- VectorVest AutoTester
- VectorVest Educational Services
- VectorVest OnLine
- VectorVest Options Analyzer
- VectorVest ProGraphics v6.0
- VectorVest ProTrader 7
- VectorVest RealTime Derby Tool
- VectorVest Simulator
- VectorVest Variator
- VectorVest Watchdog
