HOT TOPICS LIST
- MACD
- Fibonacci
- RSI
- Gann
- ADXR
- Stochastics
- Volume
- Triangles
- Futures
- Cycles
- Volatility
- ZIGZAG
- MESA
- Retracement
- Aroon
INDICATORS LIST
LIST OF TOPICS
PRINT THIS ARTICLE
by Austin Passamonte
Dynamic pivots are a charting tool measuring price levels that adjust with the flow of price action.
Position: N/A
Austin Passamonte
Austin is a private trader who trades emini stock index futures intraday. He currently trades various futures markets from home in addition to managing a trader's educational forum
PRINT THIS ARTICLE
PIVOT POINT CHANNELS
Dynamic Pivots
06/15/09 11:39:53 AMby Austin Passamonte
Dynamic pivots are a charting tool measuring price levels that adjust with the flow of price action.
Position: N/A
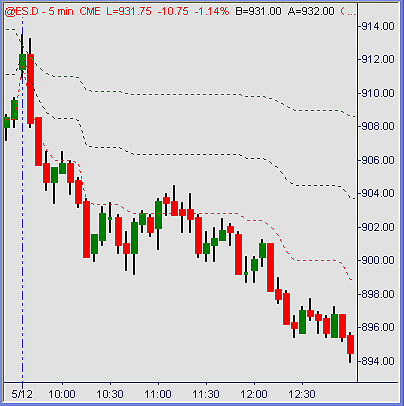
| This price study measures the current period's price range from low to high, with price values plotted of 25%, 50%, and 75% levels. These values are based on the high and low measure of any given period on a chart. For intraday or short-term trading, using the cash session (pit) only chart or all-session (24-hour) chart will give different grid levels in eminis most days. The same is true for any market that trades electronic and pit session periods. It's not a question of which time period settings "work best" for price measurement tools like this; they are designed to be used within the time frame you already trade. Whether your charts are set for cash-session only in or the entire 24-hour period reference is likewise, the preference is the same for dynamic pivot settings. They complement your existing approach, whatever it may be. For example, this five-minute chart of the Standard & Poor's 500 emini futures (ES) shows price action moving through the pivotal grid levels 75% > 50% > 25% of measure-period range levels. Price action below the 25% level is usually sustained during bearish trend moves, which the session (example above) of May 12 was. Note how each pullback to the 25% "dynamic" level zone marked a pause = continuation lower. While there is no defined edge for specific trade entry signals at the levels, using them as measuring tools for trend probability is invaluable. See Figure 1. |

|
| FIGURE 1: S&P 500 EMINI FUTURES. Note these dynamic pivots of 75%-50%-25% lines. |
| Graphic provided by: TradeStation. |
| |
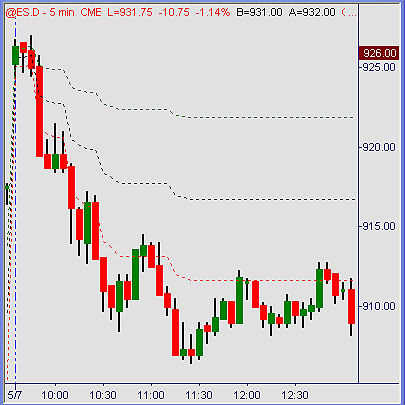
| There are many ways to use this tool as part of your trading approach. Directional bias filters would be one of those. Price action moving up or down through the scale demonstrates continued direction or possible trend reversal, depending on where it stops and starts. A basic rule of thumb is this: aggressive long mode or even long-only and no shorts above the 75% level with the opposite aggressive short mode or even short-only and no longs below the 25% level. That rule alone will keep traders seeking longs in a rising market and shorts in a falling market. When price is near/at/above its own upper 25 percentile of low to high overall range, momentum strength is obvious. The opposite is equally true when price levels are at/below the 75 percentile of high to low span, momentum weakness is glaring. A body in motion tends to stay in motion. See Figure 2. |

|
| FIGURE 2: ES. Again, note the dynamic pivots 75%-50%-25% lines. |
| Graphic provided by: TradeStation. |
| |
| Disregarding sideways choppy-sloppy sessions, any real directional push in price tends to last longer than most traders believe it can or will. Just ask anyone who has shortened their career by the too-common mistake of persisting to sell a grinding rally or buy a waterfall decline. The market itself doles out our highest-price lessons on trading. Learning from trial & error means paying through the nose for errors. Fighting a trend, be that minutes or hours in duration, has drained more trading accounts dry than any other single factor out there. Respecting price strength or weakness when clearly visible on its own percentile of range grid is one excellent way to flow with your market instead of fighting it. |
| Various chart services may offer this tool as a standard default, or have it easily written from the equation of current high-low and 25%, 50%, 75% of the range. Any chart service offering retracement grids can manually snap the low and high points of a period while measuring out the desired levels, adjusting to new highs or lows as the day wears on. Simple as that. |
| Summation There is a lot more to successful trading than knowing whether price is probable to go up or down. But that's a pretty important place to start. It is true that financial markets spend plenty of time going sideways. It is equally true that those sideways periods offer anyone and everyone the least potential for profit, period. Directional market action, up or down offers everyone the most potential for profit. Using price action studies that measure a market relative to itself for directional momentum and manage your trading decisions accordingly is a critical step for long-term success. |
Austin is a private trader who trades emini stock index futures intraday. He currently trades various futures markets from home in addition to managing a trader's educational forum
| Title: | Individual Trader |
| Company: | CoiledMarkets.com |
| Address: | PO Box 633 |
| Naples, NY 14512 | |
| Website: | coiledmarkets.com/blog |
| E-mail address: | austinp44@yahoo.com |
Traders' Resource Links | |
| CoiledMarkets.com has not added any product or service information to TRADERS' RESOURCE. | |
Click here for more information about our publications!
Comments
Date: 06/15/09Rank: 2Comment:

Request Information From Our Sponsors
- StockCharts.com, Inc.
- Candle Patterns
- Candlestick Charting Explained
- Intermarket Technical Analysis
- John Murphy on Chart Analysis
- John Murphy's Chart Pattern Recognition
- John Murphy's Market Message
- MurphyExplainsMarketAnalysis-Intermarket Analysis
- MurphyExplainsMarketAnalysis-Visual Analysis
- StockCharts.com
- Technical Analysis of the Financial Markets
- The Visual Investor
- VectorVest, Inc.
- Executive Premier Workshop
- One-Day Options Course
- OptionsPro
- Retirement Income Workshop
- Sure-Fire Trading Systems (VectorVest, Inc.)
- Trading as a Business Workshop
- VectorVest 7 EOD
- VectorVest 7 RealTime/IntraDay
- VectorVest AutoTester
- VectorVest Educational Services
- VectorVest OnLine
- VectorVest Options Analyzer
- VectorVest ProGraphics v6.0
- VectorVest ProTrader 7
- VectorVest RealTime Derby Tool
- VectorVest Simulator
- VectorVest Variator
- VectorVest Watchdog
