HOT TOPICS LIST
- MACD
- Fibonacci
- RSI
- Gann
- ADXR
- Stochastics
- Volume
- Triangles
- Futures
- Cycles
- Volatility
- ZIGZAG
- MESA
- Retracement
- Aroon
INDICATORS LIST
LIST OF TOPICS
PRINT THIS ARTICLE
by Austin Passamonte
Predictable patterns exist within the cycle of rising and lowering interest rates to help us gauge where in the economic process equity markets are. When shifting from an environment of rising to lower rates, interest-sensitive issues should be the first to recover. Deep cyclical and financial companies are key reads for market analysts to monitor.
Position: N/A
Austin Passamonte
Austin is a private trader who trades emini stock index futures intraday. He currently trades various futures markets from home in addition to managing a trader's educational forum
PRINT THIS ARTICLE
ECON CYCLE TRADING
Keys To Predicting Economy Cycles
09/06/01 01:04:46 PMby Austin Passamonte
Predictable patterns exist within the cycle of rising and lowering interest rates to help us gauge where in the economic process equity markets are. When shifting from an environment of rising to lower rates, interest-sensitive issues should be the first to recover. Deep cyclical and financial companies are key reads for market analysts to monitor.
Position: N/A
| Cyclical companies are those that make durable goods you and I depend on for everyday material items. Financial companies are in the business of exchanging money for risk. Each is directly tied to the cost of goods being bought, sold or ignored. A sustained economic and equity market upturn cannot happen without their leadership. |
| With that in mind, what are the leaders telling us? |

|
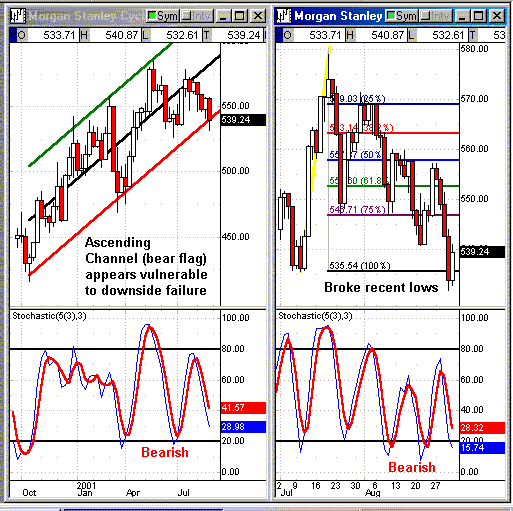
| Figure 1: Weekly/Daily Charts: CYC.X (Morgan Stanley Cyclical Index) |
| Graphic provided by: Quote.com. |
| Graphic provided by: QCharts. |
| |
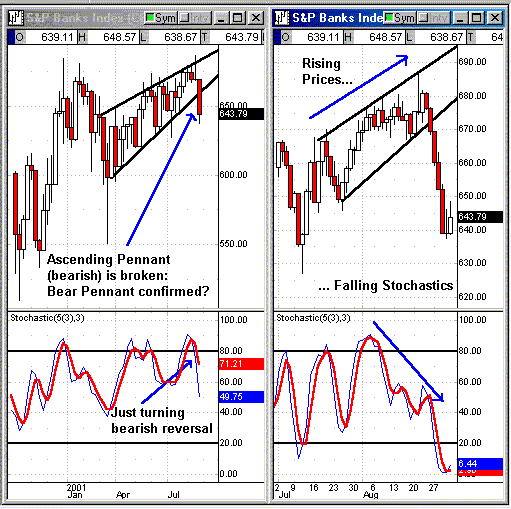
| Morgan Stanley Cyclical Index has enjoyed a continual uptrend from October 2000 until May 2001. From there it seemed to peak and may have begun a new direction downward, as we'll soon find out. Currently resting on support of the weekly chart (left) lower support line, stochastic values suggest further weakness lies directly ahead. The daily chart (right) exhibits price action stair-stepping lower as it failed near overhead resistance at measurable Fibonacci values. Relative lows from early July have been violated with no clear abatement in sight. Stochastic values remain decidedly weak at best. So... who's buying copper, aluminum, steel, lumber, paper and other durable goods? It appears that fewer consumers are making such purchases right now and scrap metal prices (not shown) continue to trade near multi-year lows as well. That is a study closely watched by Greenspan & Co, which must currently be a concern for economic recovery based on price weakness persisting at this time.  Figure 2: Weekly/Daily Charts: BIX.X (Standard & Poor's Banking Index) |
| Standard & Poor's Banking Index doesn't show bullish strength at this time, and indeed may be quite the opposite. Weekly chart (left) price action had formed an ascending bearish pennant until last week when it appears to have confirmed in a big way. Stochastic values show plenty of downside room to fall as well, and the 600 area at the bottom of this consolidation is the next measure of support. Daily-chart (right) price action had risen even as stochastic values continued to trend down. When price action moves one direction but the underlying measure of strength or weakness diverges from there, we can expect a reversal in price direction soon. And indeed it did. Watch & Wait Monitoring latent strength (or lack thereof) in these leadership indexes at the front of an interest-rate easing cycle is one clear way to measure the inevitable market bottom and subsequent turn. Meanwhile, the trend is our friend and if it continues to favor the downside, so must our trading tactics follow suit to prosper! |
Austin is a private trader who trades emini stock index futures intraday. He currently trades various futures markets from home in addition to managing a trader's educational forum
| Title: | Individual Trader |
| Company: | CoiledMarkets.com |
| Address: | PO Box 633 |
| Naples, NY 14512 | |
| Website: | coiledmarkets.com/blog |
| E-mail address: | austinp44@yahoo.com |
Traders' Resource Links | |
| CoiledMarkets.com has not added any product or service information to TRADERS' RESOURCE. | |
Click here for more information about our publications!
Comments
Date: 09/16/01Rank: 4Comment:

Request Information From Our Sponsors
- StockCharts.com, Inc.
- Candle Patterns
- Candlestick Charting Explained
- Intermarket Technical Analysis
- John Murphy on Chart Analysis
- John Murphy's Chart Pattern Recognition
- John Murphy's Market Message
- MurphyExplainsMarketAnalysis-Intermarket Analysis
- MurphyExplainsMarketAnalysis-Visual Analysis
- StockCharts.com
- Technical Analysis of the Financial Markets
- The Visual Investor
- VectorVest, Inc.
- Executive Premier Workshop
- One-Day Options Course
- OptionsPro
- Retirement Income Workshop
- Sure-Fire Trading Systems (VectorVest, Inc.)
- Trading as a Business Workshop
- VectorVest 7 EOD
- VectorVest 7 RealTime/IntraDay
- VectorVest AutoTester
- VectorVest Educational Services
- VectorVest OnLine
- VectorVest Options Analyzer
- VectorVest ProGraphics v6.0
- VectorVest ProTrader 7
- VectorVest RealTime Derby Tool
- VectorVest Simulator
- VectorVest Variator
- VectorVest Watchdog
