HOT TOPICS LIST
- MACD
- Fibonacci
- RSI
- Gann
- ADXR
- Stochastics
- Volume
- Triangles
- Futures
- Cycles
- Volatility
- ZIGZAG
- MESA
- Retracement
- Aroon
INDICATORS LIST
LIST OF TOPICS
PRINT THIS ARTICLE
by Chaitali Mohile
After hitting a target on a trend reversal pattern on daily as well as weekly time frames, RTI is consolidating for one more bullish breakout.
Position: Buy
Chaitali Mohile
Active trader in the Indian stock markets since 2003 and a full-time writer. Trading is largely based upon technical analysis.
PRINT THIS ARTICLE
REVERSAL
RTI Consolidates For Another Bullish Breakout
06/12/09 12:48:14 PMby Chaitali Mohile
After hitting a target on a trend reversal pattern on daily as well as weekly time frames, RTI is consolidating for one more bullish breakout.
Position: Buy
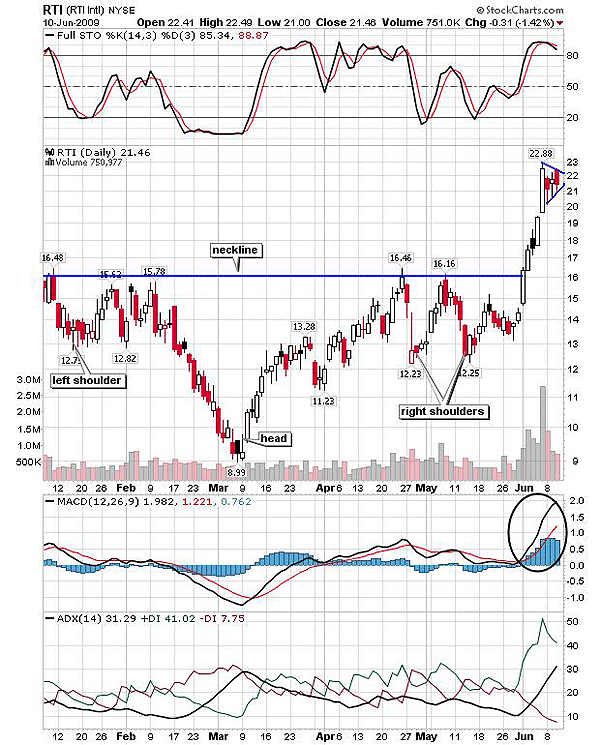
| An inverted head & shoulders is a bullish reversal pattern. RTI Intl. (RTI) formed this trend reversal pattern with the multiple (more than one) right shoulder on the daily chart in Figure 1. The pattern is a short-term reversal pattern and has already broken upward. The average directional movement index (ADX) (14) that struggled to capture one particular trend ultimately weakens. During the formation of an inverted head & shoulders pattern, the ADX (14) was weak and neutral on either of the trends. The trend indicator witnessed an equal selling and buying pressure. Therefore, the trend reversal after the bullish breakout would be the conversion of the weak trend into a developing uptrend. Gradually, the bullish breakout reversed the bearish force on the price and the indicators as well. The moving average convergence/divergence (MACD) (12,26,9) surged from negative territory. The shaky full stochastic (14,3,3) slipped above 50 levels. |

|
| FIGURE 1: RTI, DAILY. The stock has hit the target of the inverted head & shoulders pattern. The consolidation in the range of $23 and $21 formed a bullish flag & pennant continuation pattern. |
| Graphic provided by: StockCharts.com. |
| |
| RTI violated the neckline resistance at $16 and rallied upward. The potential target is measured by adding the breakout level to the length of head; $16 - $9 = $7 + $16 (breakout level) = $23. In Figure 1, we can see that RTI has almost reached the targeted level of $23 and has moved sideways. Currently, the stock is consolidating, forming a bullish flag & pennant continuation pattern. The ADX (14) is indicating the developed uptrend, the MACD (12,26,9) is positive, and the stochastic oscillator is well overbought. Therefore, the bullish breakout of the flag & pennant is well escorted by the technical indicators. |
| Therefore, traders can initiate the fresh long trades on a confirmed breakout above $23. The breakout with the higher volume would pour stability and strength in the rally. Traders can hold their positions with the target of $23 - $16 = $7 + $23 (breakout level) = $30. Since the stock is consolidating at the current level, traders should avoid trading on anticipatory breakout. Those already in trade at $16 can book the profits and reenter the stock after the confirmed breakout at $23 with the long-term target of $30. |

|
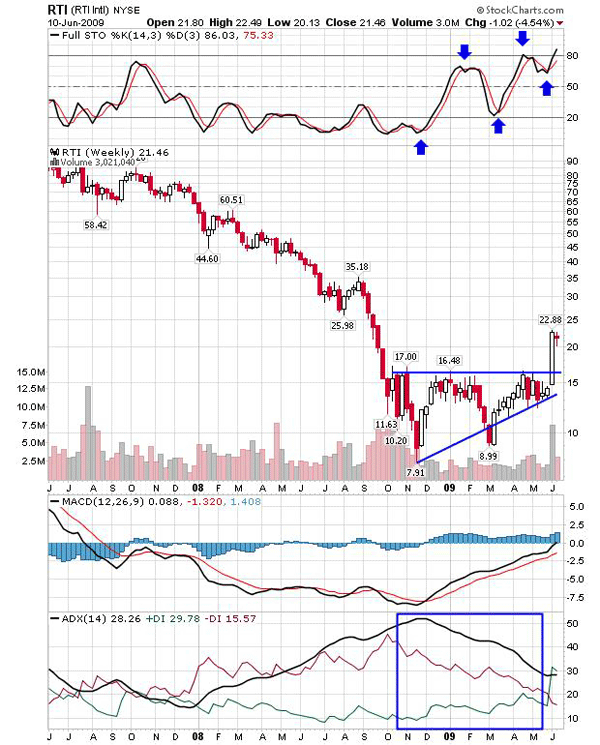
| FIGURE 2: RTI, WEEKLY. The stock formed an ascending triangle at the lowest levels in the downtrend. |
| Graphic provided by: StockCharts.com. |
| |
| After a huge correction, RTI formed an ascending triangle on the weekly chart in Figure 2. An ascending triangle in an uptrend is a continuation pattern, but in a developed downtrend, the pattern is considered as a trend reversal. The ADX (14) in Figure 2 descended from an overheated downtrend levels, so the stock formed higher lows. The positive MACD (12,26,9) is rallying vertically upward and is ready to slip into positive territory. The full stochastic formed the higher highs and the higher lows. Everything together resulted in the formation of the ascending triangle. Recently, RTI has witnessed a bullish reversal breakout with the strong support of the positive indicators. The developing uptrend, the positive MACD (12,26,9), and the overbought stochastic oscillator would carry the stock toward the target of $17 - $8 = $9 + $16 = $26. |
| According to Figure 2, RTI moved halfway toward the target. The stock might consolidate during its upward journey but would resume the path later. Therefore, the new breakout above the upper range of consolidation would issue the fresh buying indications. |
Active trader in the Indian stock markets since 2003 and a full-time writer. Trading is largely based upon technical analysis.
| Company: | Independent |
| Address: | C1/3 Parth Indraprasth Towers. Vastrapur |
| Ahmedabad, Guj 380015 | |
| E-mail address: | chaitalimohile@yahoo.co.in |
Traders' Resource Links | |
| Independent has not added any product or service information to TRADERS' RESOURCE. | |
Click here for more information about our publications!
PRINT THIS ARTICLE

Request Information From Our Sponsors
- StockCharts.com, Inc.
- Candle Patterns
- Candlestick Charting Explained
- Intermarket Technical Analysis
- John Murphy on Chart Analysis
- John Murphy's Chart Pattern Recognition
- John Murphy's Market Message
- MurphyExplainsMarketAnalysis-Intermarket Analysis
- MurphyExplainsMarketAnalysis-Visual Analysis
- StockCharts.com
- Technical Analysis of the Financial Markets
- The Visual Investor
- VectorVest, Inc.
- Executive Premier Workshop
- One-Day Options Course
- OptionsPro
- Retirement Income Workshop
- Sure-Fire Trading Systems (VectorVest, Inc.)
- Trading as a Business Workshop
- VectorVest 7 EOD
- VectorVest 7 RealTime/IntraDay
- VectorVest AutoTester
- VectorVest Educational Services
- VectorVest OnLine
- VectorVest Options Analyzer
- VectorVest ProGraphics v6.0
- VectorVest ProTrader 7
- VectorVest RealTime Derby Tool
- VectorVest Simulator
- VectorVest Variator
- VectorVest Watchdog
