HOT TOPICS LIST
- MACD
- Fibonacci
- RSI
- Gann
- ADXR
- Stochastics
- Volume
- Triangles
- Futures
- Cycles
- Volatility
- ZIGZAG
- MESA
- Retracement
- Aroon
INDICATORS LIST
LIST OF TOPICS
PRINT THIS ARTICLE
by Donald W. Pendergast, Jr.
The inverse relationship between the Australian dollar and the US dollar comes to life as the chart tells the tale of two currencies.
Position: N/A
Donald W. Pendergast, Jr.
Donald W. Pendergast is a financial markets consultant who offers specialized services to stock brokers and high net worth individuals who seek a better bottom line for their portfolios.
PRINT THIS ARTICLE
ACCUM./DIST. CHAIKIN
In The US Dollar ETF, When UUP Means Down
06/12/09 02:10:26 PMby Donald W. Pendergast, Jr.
The inverse relationship between the Australian dollar and the US dollar comes to life as the chart tells the tale of two currencies.
Position: N/A
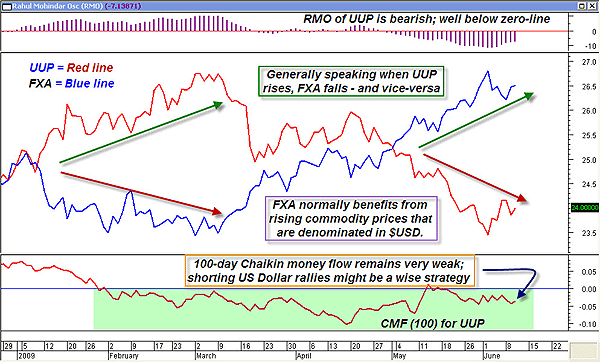
| One of the most interesting groups of exchange traded funds (ETFs) allows traders to invest in (or bet against) the global currencies of their choice. All of the major currencies are covered, including the US dollar (UUP) and the Australian dollar (FXA), our choices for this particular article. Running both tickers through a one-year correlation calculator reveals the two ETFs to be nearly perfectly inversely correlated, coming in with a reading of (0.95). Even a six-month correlation demonstrates strong polarity, with the number being (0.85). Essentially, this simply means that when UUP rises, FXA will normally fall; conversely, when FXA moves higher, UUP will usually move lower. |

|
| FIGURE 1: UUP/FXA, DAILY. Despite a minor rally in the greenback, until the money flow and momentum readings manage a close above their respective zero-lines, shorting UUP and/or FXA on pullbacks might be wise. |
| Graphic provided by: MetaStock. |
| Graphic provided by: Rahul Mohindar oscillator (RMO) from Metastock. |
| |
| As Figure 1 shows, this inverse relationship has remained constant for some time. Currently, UUP (the red line on center of chart) seems to have found a measure of support, causing a small two-week rally to the $24 area. However, if you look at the longer-term Chaikin money flow (CMF)(100) on the lower part of the chart, you'll see that it dipped below its zero-line in late January 2009 and has been unable to rise above it since then. There is evidence of some positive money flow divergence in recent weeks, but the price action in UUP needs to embark on a more sustained trend higher for this divergence to prove out; after all, it's the price action on the chart that matters more than anything else. At the very top of the chart, also note that the Rahul Mohindar oscillator (RMO) is deeply submerged beneath its own zero-line, with no evidence of positive price-momentum divergence at all. All told, UUP could be an attractive short candidate on further rallies as long as the RMO and CMF 100 each remain below zero. Or, if you're uncomfortable taking short positions, taking long entries in FXA might be more appropriate. Both ETFs also offer a range of call and put options, with current option expirations going out as far as December 2009. |
| The US dollar (USD), represented in the ETF world by UUP or UDN among others, began a long-term secular bear market in 2002. Despite several corrective moves higher along the way, the fundamentals for the USD are among the worst ever seen for a currency enjoying reserve status. According to some estimates, the total real outstanding debts, obligations, and unfunded liabilities of the US government range from $50 to $120 trillion, depending on who's doing the number-crunching. Clearly, if such estimates are even remotely accurate, heavy pressure will remain on the USD for many years to come, despite the occasional technical rallies that will inevitably appear. Even more foreboding for the US, there is evidence that China has begun a series of currency swap deals with nations like Russia, Iran, and Brazil (as well as several others) in order to assure their independence from the US dollar in some of their global commerce. If these types of currency trade deals become more widespread, there will be even more downward pressure on the US dollar, possibly even a major run out of the currency itself by traders and investors aware of the seriousness of the situation. |

|
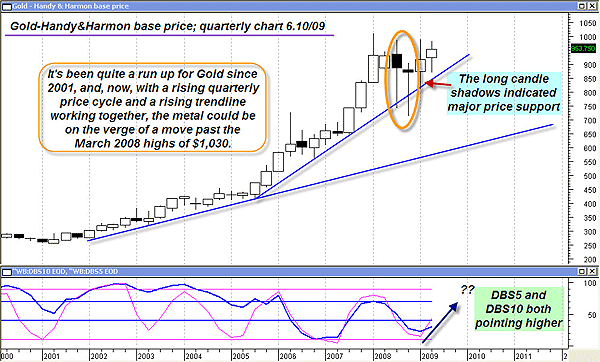
| FIGURE 2: GOLD, QUARTERLY. With a rising price cycle and a well-established trendline in force, buying more gold on pullbacks appears to be both a sound trading strategy and a great long-term hedge against further US dollar declines. |
| Graphic provided by: MetaStock. |
| Graphic provided by: Various indicators from ProfitTrader for Metastock. |
| |
| Meanwhile, gold, the US dollar's eternal nemesis, has been hanging tough and, despite many predictions of the imminent death of the global commodity bull market, the yellow metal simply refuses to sell off to any degree of consequence. Perhaps that rising monthly and quarterly price cycle/trendline in the metal (Figure 2) has something to do with that stubborn refusal of gold to drop back into the $800 range, at least not without a major fight. So traders and investors who buy the declining-dollar scenario might consider adding more FXA shares, gold, and silver to their portfolios each time an attractive pullback opportunity presents itself. The US dollar's fundamentals are going to take many years to get fixed, so why not make some extra dollars while you can, using the charts to help you to cash in as opportunities present themselves? Owning a basket of global currency ETFs and gold makes a lot of sense under such conditions at least for the next three to five years, if not more. |
Donald W. Pendergast is a financial markets consultant who offers specialized services to stock brokers and high net worth individuals who seek a better bottom line for their portfolios.
| Title: | Writer, market consultant |
| Company: | Linear Trading Systems LLC |
| Jacksonville, FL 32217 | |
| Phone # for sales: | 904-239-9564 |
| E-mail address: | lineartradingsys@gmail.com |
Traders' Resource Links | |
| Linear Trading Systems LLC has not added any product or service information to TRADERS' RESOURCE. | |
Click here for more information about our publications!
Comments
Date: 06/15/09Rank: 4Comment:

Request Information From Our Sponsors
- StockCharts.com, Inc.
- Candle Patterns
- Candlestick Charting Explained
- Intermarket Technical Analysis
- John Murphy on Chart Analysis
- John Murphy's Chart Pattern Recognition
- John Murphy's Market Message
- MurphyExplainsMarketAnalysis-Intermarket Analysis
- MurphyExplainsMarketAnalysis-Visual Analysis
- StockCharts.com
- Technical Analysis of the Financial Markets
- The Visual Investor
- VectorVest, Inc.
- Executive Premier Workshop
- One-Day Options Course
- OptionsPro
- Retirement Income Workshop
- Sure-Fire Trading Systems (VectorVest, Inc.)
- Trading as a Business Workshop
- VectorVest 7 EOD
- VectorVest 7 RealTime/IntraDay
- VectorVest AutoTester
- VectorVest Educational Services
- VectorVest OnLine
- VectorVest Options Analyzer
- VectorVest ProGraphics v6.0
- VectorVest ProTrader 7
- VectorVest RealTime Derby Tool
- VectorVest Simulator
- VectorVest Variator
- VectorVest Watchdog
