HOT TOPICS LIST
- MACD
- Fibonacci
- RSI
- Gann
- ADXR
- Stochastics
- Volume
- Triangles
- Futures
- Cycles
- Volatility
- ZIGZAG
- MESA
- Retracement
- Aroon
INDICATORS LIST
LIST OF TOPICS
PRINT THIS ARTICLE
by Koos van der Merwe
Cyclical investing suggests that in the month of June, investors should stay in Treasury bills but start looking for bottoms to buy. Biomirin Pharma could be such a bottom.
Position: Accumulate
Koos van der Merwe
Has been a technical analyst since 1969, and has worked as a futures and options trader with First Financial Futures in Johannesburg, South Africa.
PRINT THIS ARTICLE
ELLIOTT WAVE
Bottoms To Buy
06/12/09 12:12:46 PMby Koos van der Merwe
Cyclical investing suggests that in the month of June, investors should stay in Treasury bills but start looking for bottoms to buy. Biomirin Pharma could be such a bottom.
Position: Accumulate
| BioMarin develops innovative biopharmaceuticals for serious diseases and medical conditions. The company's product portfolio is made up of three approved products and multiple clinical and preclinical product candidates. The reward will come when any of the product candidates is approved by the FDA. The risk, of course, is that they are barking at shadows, and all their research will be null and void. However, they do have three approved products, which means that the company has income. Its major contributor to sales growth out to 2010 will be the product sales of Naglazyme, which is forecast to increase from $50 million in 2006 to $328 million in 2010. |

|
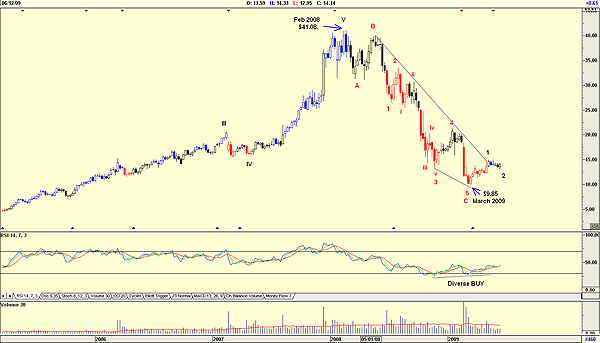
| FIGURE 1: BMRN, WEEKLY. Note how the price has fallen from a high of $41.08 in February 2008 all the way to $9.85 by March 2009. |
| Graphic provided by: AdvancedGET. |
| |
| Figure 1 is a weekly chart that shows how the price has fallen from a high of $41.08 reached in February 2008 to the low of $9.85 by March 2009. Elliot wave theory suggests that a C-wave correction is now complete, and that the price is now moving into a wave 1/wave 2 of the start of a new bullish formation. This is confirmed by the price's move above the downtrend resistance line, and the diversification buy signal on the relative strength index (RSI). On the wave 2 correction, volume is below average. |

|
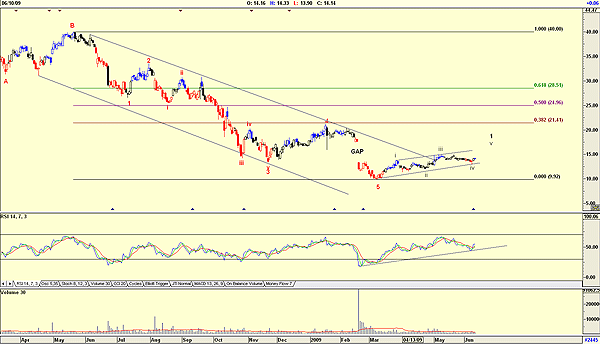
| FIGURE 2: BMRN, DAILY. The wave 1 seen here does not seem to be complete. |
| Graphic provided by: AdvancedGET. |
| |
| Figure 2 shows how the price has risen to fill the gap, but at the same time suggests that wave 1 is not complete. This is confirmed by the RSI, which is still bullish. Targets shown by the Fibonacci retracement are suggestive of where the price could rise to, but in a new bull market, these targets become resistance levels. There's a cyclical theory that says, "Start looking for bottoms as June comes to an end; stay in stocks through July; sell into strength in mid-August." Biomarin is one stock that may fit the bill, so it may be something to place on your watchlist as a future buy. |
Has been a technical analyst since 1969, and has worked as a futures and options trader with First Financial Futures in Johannesburg, South Africa.
| Address: | 3256 West 24th Ave |
| Vancouver, BC | |
| Phone # for sales: | 6042634214 |
| E-mail address: | petroosp@gmail.com |
Click here for more information about our publications!
Comments
Date: 06/15/09Rank: 3Comment:

Request Information From Our Sponsors
- StockCharts.com, Inc.
- Candle Patterns
- Candlestick Charting Explained
- Intermarket Technical Analysis
- John Murphy on Chart Analysis
- John Murphy's Chart Pattern Recognition
- John Murphy's Market Message
- MurphyExplainsMarketAnalysis-Intermarket Analysis
- MurphyExplainsMarketAnalysis-Visual Analysis
- StockCharts.com
- Technical Analysis of the Financial Markets
- The Visual Investor
- VectorVest, Inc.
- Executive Premier Workshop
- One-Day Options Course
- OptionsPro
- Retirement Income Workshop
- Sure-Fire Trading Systems (VectorVest, Inc.)
- Trading as a Business Workshop
- VectorVest 7 EOD
- VectorVest 7 RealTime/IntraDay
- VectorVest AutoTester
- VectorVest Educational Services
- VectorVest OnLine
- VectorVest Options Analyzer
- VectorVest ProGraphics v6.0
- VectorVest ProTrader 7
- VectorVest RealTime Derby Tool
- VectorVest Simulator
- VectorVest Variator
- VectorVest Watchdog
