HOT TOPICS LIST
- MACD
- Fibonacci
- RSI
- Gann
- ADXR
- Stochastics
- Volume
- Triangles
- Futures
- Cycles
- Volatility
- ZIGZAG
- MESA
- Retracement
- Aroon
INDICATORS LIST
LIST OF TOPICS
PRINT THIS ARTICLE
by Chaitali Mohile
Although the technology stocks have been struggling to break out, Microsoft is an exception to this group. Recently, the stock witnessed a bullish breakout, generating healthy trading opportunity.
Position: Buy
Chaitali Mohile
Active trader in the Indian stock markets since 2003 and a full-time writer. Trading is largely based upon technical analysis.
PRINT THIS ARTICLE
BREAKOUTS
Microsoft Buy Signal
06/11/09 01:43:50 PMby Chaitali Mohile
Although the technology stocks have been struggling to break out, Microsoft is an exception to this group. Recently, the stock witnessed a bullish breakout, generating healthy trading opportunity.
Position: Buy
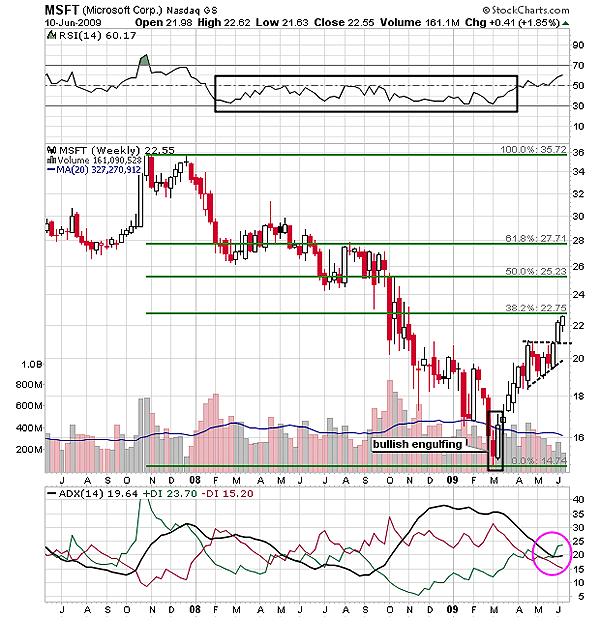
| The bullish engulfing candlestick pattern in Figure 1 initiated a bullish reversal rally in Microsoft (MSFT). The stock rushed above the resistance zone at $21 and moved sideways. The consolidation in a narrow range of $18 and $21 formed a bullish flag and pennant continuation pattern. The pennant formed in Figure 1 reflects the consolidation period after an exclusive advance rally. Very recently, MSFT has broken upward. The breakout target for MSFT would be 21 - 14 = 7 (size of flagpole) + 21 (breakout level) = 28. Therefore, the stock could hit a minimal estimate of $28. But the Fibonacci retracement tool shows resistance for the bullish price action; 38.2% retracement level is an immediate resistance of MSFT. |
| Let's have a look at the indicators for a low-risk entry. In 2008, MSFT plunged from $36 to $26. During this period, the relative strength index (RSI) (14) was range-bound between 30 and 50, indicating a bearish force on the descending rally. The bearish strength sustained for a longer period; as a result, the RSI (14) failed in every attempt made to surge above 50 (the bullish levels). |

|
| FIGURE 1: MSFT, WEEKLY. The flag and pennant breakout rally of MSFT has an immediate resistance of 38.2% Fibonacci retracement level. |
| Graphic provided by: StockCharts.com. |
| |
| The average directional movement index (ADX) (14) indicated a developing downtrend in early 2009, but as the price made lower lows, the developing downtrend climbed higher and soon hit the overheated levels. An overheated uptrend or downtrend is usually a trend reversal signal. In Figure 1, we can see the ADX (14) declined from an overheated level at 40, indicating trend reversal. This encouraged the bullish rally and buying pressure indicated by a positive directional index (+DI) as well. Gradually, the ADX (14) descended to 19 levels and the +DI surged above the selling pressure indicated by the negative divergence index (-DI). This suggests the possibility of a developing uptrend on a weekly time frame in Figure 1. |
| Recently, the RSI (14) has surged and has established support at 50 levels. The bullish breakout of the momentum indicator signifies a developing bullish strength. The ADX (14) above 20 would begin a fresh uptrend. Therefore, the bullish RSI (14) and the increased +DI would help MSFT reach its breakout target of $28. Although the Fibonacci retracement levels of 38.2% and 50% are the resistance for MSFT, they can be observed as intermediate targets as well. Currently, MSFT is under the 38.2% resistance level. The white candles reflect the strength in the rally, and therefore, MSFT is fully loaded with the bullish force. |

|
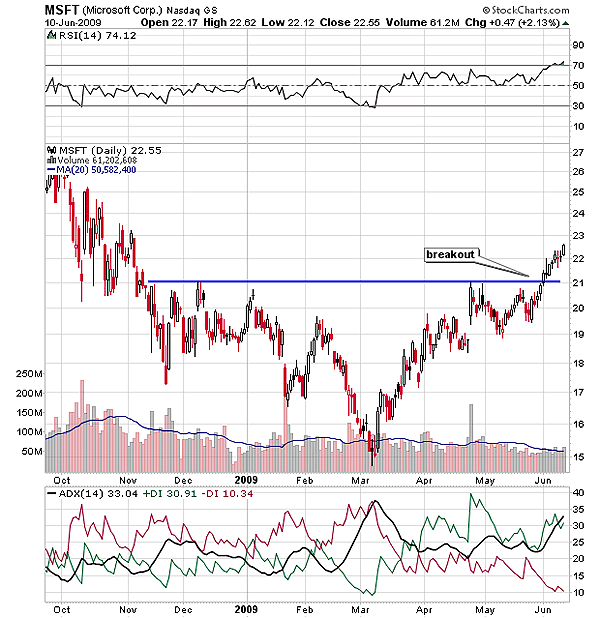
| FIGURE 2: MSFT, DAILY. The RSI (14) has surged in an overbought zone above 70 levels. The ADX (14) shows a robust uptrend for MSFT. The bullish indicators would make the breakout rally healthier. |
| Graphic provided by: StockCharts.com. |
| |
| In Figure 2, MSFT violated the previous high resistance levels indicated by the blue line on the price chart. For the short-term traders, this can be the best buying signals, as fresh support has been established. The breakout occurred at $21, so those already long at these levels are enjoying healthy profits. The ADX (14) on the daily time frame in Figure 2 is indicating a well-developed uptrend. After the price breakout, the RSI (14) that was ranging between the bullish levels at 50 and 70 violated the upper resistance levels. The breakout of an upper range of the oscillator has added confidence among traders. Hence, MSFT would move higher toward the long-term target of $28. The Fibonacci retracement levels can be the short-term targets for the fresh long trade. Thus, traders can initiate fresh long positions in MSFT with these targets. |
Active trader in the Indian stock markets since 2003 and a full-time writer. Trading is largely based upon technical analysis.
| Company: | Independent |
| Address: | C1/3 Parth Indraprasth Towers. Vastrapur |
| Ahmedabad, Guj 380015 | |
| E-mail address: | chaitalimohile@yahoo.co.in |
Traders' Resource Links | |
| Independent has not added any product or service information to TRADERS' RESOURCE. | |
Click here for more information about our publications!
PRINT THIS ARTICLE

Request Information From Our Sponsors
- StockCharts.com, Inc.
- Candle Patterns
- Candlestick Charting Explained
- Intermarket Technical Analysis
- John Murphy on Chart Analysis
- John Murphy's Chart Pattern Recognition
- John Murphy's Market Message
- MurphyExplainsMarketAnalysis-Intermarket Analysis
- MurphyExplainsMarketAnalysis-Visual Analysis
- StockCharts.com
- Technical Analysis of the Financial Markets
- The Visual Investor
- VectorVest, Inc.
- Executive Premier Workshop
- One-Day Options Course
- OptionsPro
- Retirement Income Workshop
- Sure-Fire Trading Systems (VectorVest, Inc.)
- Trading as a Business Workshop
- VectorVest 7 EOD
- VectorVest 7 RealTime/IntraDay
- VectorVest AutoTester
- VectorVest Educational Services
- VectorVest OnLine
- VectorVest Options Analyzer
- VectorVest ProGraphics v6.0
- VectorVest ProTrader 7
- VectorVest RealTime Derby Tool
- VectorVest Simulator
- VectorVest Variator
- VectorVest Watchdog
