HOT TOPICS LIST
- MACD
- Fibonacci
- RSI
- Gann
- ADXR
- Stochastics
- Volume
- Triangles
- Futures
- Cycles
- Volatility
- ZIGZAG
- MESA
- Retracement
- Aroon
INDICATORS LIST
LIST OF TOPICS
PRINT THIS ARTICLE
by Donald W. Pendergast, Jr.
The broad markets have been unpredictable of late, but the weekly charts seem to imply that the bias is toward further gains.
Position: Accumulate
Donald W. Pendergast, Jr.
Donald W. Pendergast is a financial markets consultant who offers specialized services to stock brokers and high net worth individuals who seek a better bottom line for their portfolios.
PRINT THIS ARTICLE
AROON
Broad Markets Preparing For Another Push Higher?
06/11/09 09:08:01 AMby Donald W. Pendergast, Jr.
The broad markets have been unpredictable of late, but the weekly charts seem to imply that the bias is toward further gains.
Position: Accumulate
| The broad US markets may be climbing the proverbial "wall of worry" that seems to characterize every major bull market. During each stage of the bull market (duration, as always, unknown), traders and investors tend to be caught in a state of disbelief as the markets receive massive amounts of political and economic news (mostly negative as of late), earnings hits and misses, and everything else perceived to influence the market to move lower, but alas, the markets keep grinding higher despite occasional pauses to rest. While no one knows if the broad markets will continue to move higher, the current market does certainly seem to fit the wall of worry profile. A look at a weekly chart comes next. |

|
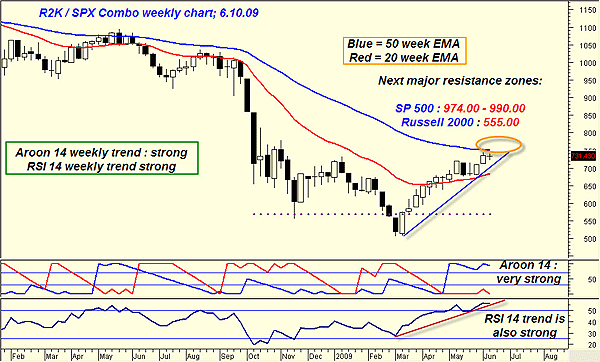
| FIGURE 1: R2K/SPX, WEEKLY. Given the strong trend and momentum characteristics shown here, biasing your trading toward the long side of the markets would appear to make a lot of sense. |
| Graphic provided by: MetaStock. |
| |
| Displayed in Figure 1 is the combo Russell 2000/Standard & Poor's 500 weekly chart. It's a smart way to discern both the large-cap and small-cap sectors of the market are in agreement. Currently, they're both suggesting that the current uptrend may still have some legs; the Aroon (14) indicator is in its strongest bullish phase in more than a year, a solid trendline has formed, and the weekly relative strength index (RSI)(14) also features a bullish trendline and is well above the 50 level, thus confirming the general bullishness, especially when combined with the strong weekly Aroon posture. The next big obstacle for both of these markets will be the various Fibonacci 50% retracement levels (based on the downswing that commenced last September), with the S&P 500 also having 50-week exponential moving average (EMA) resistance near 974. The Russell's 50% retracement level is near 555, while the S&P's 50% retracement comes in at 990. |

|
| FIGURE 2: INDUSTRY GROUPS, STRONGEST. While the automotive industry group fund (FSAVX) remains strong, more notable is the rise of the brokerage & investment management fund (FSLBX). |
| Graphic provided by: MetaStock. |
| |
| So for now, the line of least resistance appears to be up, but again, expect that wall of worry to loom large over the day-to-day moves in the broad markets. Meanwhile, Figure 2 provides a look at the strongest Fidelity Select Sector funds, hopefully giving a rough idea as to which industry groups/sectors may offer the lowest-risk, highest-probability places to deploy your trading capital. The automotive (FSAVX) group retains very strong intermediate- to long-term relative strength, as does paper and forest products (FSPFX). New to the top five, however, is the brokerage and investment management (FSLBX) group, a very exciting addition, seeing how heavily weighted the S&P 500 is biased toward the financial sector. If this particular fund keeps gaining, it will bode well for more sustained gains in the entire S&P 500. Here are some of the big brokerage names/tickers recently contained within FSLBX: Intercontinental Exchange Inc.: ICE Charles Schwab: SCHW Legg Mason: LM Bank of New York Mellon: BNY MF Global Inc.: MF CME Group, Inc.: CME |
Donald W. Pendergast is a financial markets consultant who offers specialized services to stock brokers and high net worth individuals who seek a better bottom line for their portfolios.
| Title: | Writer, market consultant |
| Company: | Linear Trading Systems LLC |
| Jacksonville, FL 32217 | |
| Phone # for sales: | 904-239-9564 |
| E-mail address: | lineartradingsys@gmail.com |
Traders' Resource Links | |
| Linear Trading Systems LLC has not added any product or service information to TRADERS' RESOURCE. | |
Click here for more information about our publications!
Comments
Date: 06/11/09Rank: 3Comment:

Request Information From Our Sponsors
- StockCharts.com, Inc.
- Candle Patterns
- Candlestick Charting Explained
- Intermarket Technical Analysis
- John Murphy on Chart Analysis
- John Murphy's Chart Pattern Recognition
- John Murphy's Market Message
- MurphyExplainsMarketAnalysis-Intermarket Analysis
- MurphyExplainsMarketAnalysis-Visual Analysis
- StockCharts.com
- Technical Analysis of the Financial Markets
- The Visual Investor
- VectorVest, Inc.
- Executive Premier Workshop
- One-Day Options Course
- OptionsPro
- Retirement Income Workshop
- Sure-Fire Trading Systems (VectorVest, Inc.)
- Trading as a Business Workshop
- VectorVest 7 EOD
- VectorVest 7 RealTime/IntraDay
- VectorVest AutoTester
- VectorVest Educational Services
- VectorVest OnLine
- VectorVest Options Analyzer
- VectorVest ProGraphics v6.0
- VectorVest ProTrader 7
- VectorVest RealTime Derby Tool
- VectorVest Simulator
- VectorVest Variator
- VectorVest Watchdog
