HOT TOPICS LIST
- MACD
- Fibonacci
- RSI
- Gann
- ADXR
- Stochastics
- Volume
- Triangles
- Futures
- Cycles
- Volatility
- ZIGZAG
- MESA
- Retracement
- Aroon
INDICATORS LIST
LIST OF TOPICS
PRINT THIS ARTICLE
by Donald W. Pendergast, Jr.
The retail industry stocks have been very strong lately; here's a look at one of the stronger stocks from this group.
Position: Accumulate
Donald W. Pendergast, Jr.
Donald W. Pendergast is a financial markets consultant who offers specialized services to stock brokers and high net worth individuals who seek a better bottom line for their portfolios.
PRINT THIS ARTICLE
MOMENTUM
SHLD's Strong Daily Momentum
06/10/09 11:59:13 AMby Donald W. Pendergast, Jr.
The retail industry stocks have been very strong lately; here's a look at one of the stronger stocks from this group.
Position: Accumulate
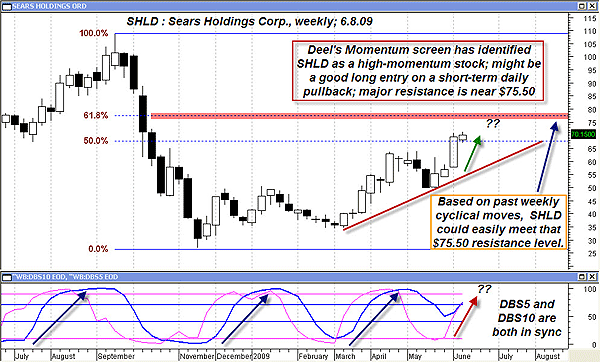
| Sears Holdings Corp. (SHLD) stock has made a nice comeback since bottoming in late 2008 along with the rest of the broad US markets. In fact, prices are so strong that SHLD is one of the top performers in the Standard & Poor's 500 since coming out of the major low in March 2009. The Deel momentum filter, a standard MetaStock exploration, also indicates that SHLD is a stock that is likely to retain its upward momentum for the time being. As always, the charts will help us determine the technical state of the stocks we follow. |

|
| FIGURE 1: SHLD, WEEKLY. Higher highs and higher lows, strong strong cyclically based momentum and a break above the Fibonacci 50% resistance barrier all combine to suggest that SHLD may have a good chance at reaching the next Fibonacci barrier (62%) near $75.50. |
| Graphic provided by: MetaStock. |
| Graphic provided by: Various indicators: ProfitTrader for MetaStock. |
| |
| Figure 1 seems simple enough; the stock is in a strong weekly uptrend (higher highs and higher lows, with a very bullish-looking trendline to boot), and it's just broken through the Fibonacci 50% retracement of the 2009 downdraft and, even more interesting, both of the WB EOD Profit Trader indicators (the half-cycle DBS5 in pink and the full-cycle DBS10 in blue) are in strong agreement that the current weekly cycle likely has some more strength remaining before an eventual reversal or consolidation occurs. In fact, if you look at the typical swing length of prior swings, it appears that there is a strong likelihood that the cycle highs might occur at or near that Fibonacci 62% retracement barrier near $75.50. Of course, no one knows how the move will play out exactly, but at least these noncorrelated measures of technical action seem to be in harmony regarding a logical turning and/or pausing point for SHLD shares on this weekly time frame. |
| Taking advantage of SHLD's strong momentum shouldn't be too hard to do; intraday traders (15- to 60-minute time frames) might want to trade pullbacks against the uptrend, taking confirmed intraday buy signals for as long as SHLD keeps chugging higher on the daily/weekly charts. Daily traders can do the same, being sure to monitor the stock closely, should it start to approach that Fibonacci 62% barrier near $75.50. Finally, those with a slightly longer time horizon might want to sell a covered call against every 100 shares of SHLD owned. Right now, traders who are willing to bet that SHLD will close at or above $65 in the next 10 days (June 19, 2009, being option expiration Friday) can collect about 6.25 (or $625) by selling a June 2009 $65 call option against their SHLD shares, netting themselves an annualized gain of nearly 50% in a week and a half, as long as the stock is called away. I doubt that even a professional gambler could pass up a potential gain like that, given the combination of SHLD's solid weekly uptrend, positive price cycle, and limited time left till options expiration. If the stock closes below $65 at any time between now and option expiration, simply close out the trade for a small loss. In the meantime, the call option will lose incredible amounts of time premium every day, even if the stock begins to move sideways. That's one of the beauties of selling options -- the mathematical certainty that every option will lose all of its time value (extrinsic value) at the time of options expiration. And that is another valuable trading dynamic that can be put to work for traders and investors of every type, helping to give themselves a meaningful edge in the stock and commodity markets. |
Donald W. Pendergast is a financial markets consultant who offers specialized services to stock brokers and high net worth individuals who seek a better bottom line for their portfolios.
| Title: | Writer, market consultant |
| Company: | Linear Trading Systems LLC |
| Jacksonville, FL 32217 | |
| Phone # for sales: | 904-239-9564 |
| E-mail address: | lineartradingsys@gmail.com |
Traders' Resource Links | |
| Linear Trading Systems LLC has not added any product or service information to TRADERS' RESOURCE. | |
Click here for more information about our publications!
Comments
Date: 06/10/09Rank: 3Comment:

Request Information From Our Sponsors
- VectorVest, Inc.
- Executive Premier Workshop
- One-Day Options Course
- OptionsPro
- Retirement Income Workshop
- Sure-Fire Trading Systems (VectorVest, Inc.)
- Trading as a Business Workshop
- VectorVest 7 EOD
- VectorVest 7 RealTime/IntraDay
- VectorVest AutoTester
- VectorVest Educational Services
- VectorVest OnLine
- VectorVest Options Analyzer
- VectorVest ProGraphics v6.0
- VectorVest ProTrader 7
- VectorVest RealTime Derby Tool
- VectorVest Simulator
- VectorVest Variator
- VectorVest Watchdog
- StockCharts.com, Inc.
- Candle Patterns
- Candlestick Charting Explained
- Intermarket Technical Analysis
- John Murphy on Chart Analysis
- John Murphy's Chart Pattern Recognition
- John Murphy's Market Message
- MurphyExplainsMarketAnalysis-Intermarket Analysis
- MurphyExplainsMarketAnalysis-Visual Analysis
- StockCharts.com
- Technical Analysis of the Financial Markets
- The Visual Investor
