HOT TOPICS LIST
- MACD
- Fibonacci
- RSI
- Gann
- ADXR
- Stochastics
- Volume
- Triangles
- Futures
- Cycles
- Volatility
- ZIGZAG
- MESA
- Retracement
- Aroon
INDICATORS LIST
LIST OF TOPICS
PRINT THIS ARTICLE
by David Penn
Could an upside breakout from an intermediate head and shoulders bottom put October crude above 30?
Position: N/A
David Penn
Technical Writer for Technical Analysis of STOCKS & COMMODITIES magazine, Working-Money.com, and Traders.com Advantage.
PRINT THIS ARTICLE
HEAD & SHOULDERS
Is Crude Ready to Move?
09/05/01 04:56:37 PMby David Penn
Could an upside breakout from an intermediate head and shoulders bottom put October crude above 30?
Position: N/A
| While there are few direct correlations between different tradables with which I feel entirely comfortable, the intermediate term moves of both light crude and heating oil have caught my eye. Both tradables are in the late stages of intermediate head and shoulders bottoms. But where crude oil has yet to break out, heating oil has already experienced both a break out and a pull back. The question here is whether or not the intermediate head and shoulders bottom in light crude will be resolved in a fashion similar to the intermediate head and shoulders bottom in heating oil. |
| Both light crude and heating oil began descending in June, as part of the correction from the April Rally, a tide that truly semed to lift all boats. Intermediate bottoms were reached by both crude and heating oil in mid-June (the left shoulder), early July (the head), and mid-August (the right shoulder). In the case of heating oil, prices broke out strongly near the end of August, then spent two days retracing the breakout, taking prices back beneath the neckline at 7625. The 7625 level, incidentally, remains key, as does the 7525 level which marks both where the break out began and where the pull back, as of August 30, had ended. |

|
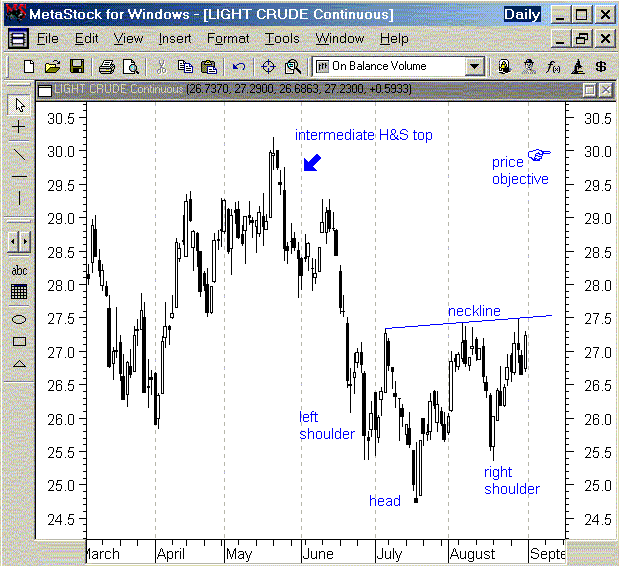
| An intermediate H&S bottom following an intermediate H&S top could send crude prices back to year-to-date highs. |
| Graphic provided by: MetaStock. |
| |
| In the case of crude, however, there has been no breakout as yet. Intraday tests of the neckline at 27.6 have been frequent throughout August, but the neckline has yet to be vigorously challenged (i.e., a successful close above 27.6). It is worthwhile to note both that heating oil's otherwise similar, intermediate H&S bottom experienced a pull back during its breakout, as well as the fact that crude has not vigorously tested its neckline. These two factors would suggest caution during any upside breakout in crude--insofar as both factors point to some potential weakness in the event that crude prices try to make an advance. |
| Interestingly, the present intermediate H&S bottom in light crude mirrors an intermediate H&S top from the spring. Specifically, the spring intermediate H&S top runs from April (left shoulder), peaks in May (head), and completes in June (right shoulder). It was the downside breakout from 28.3 to 25.5 by late June that provided the context for the current intermediate head and shoulders bottom. |
| Should the intermediate head and shoulders bottom in light crude result in an upside breakout, resistance to an upside move would not begin until prices reached 28, just above the breakout neckline from the previous intermediate head and shoulders top. However, the size of the current formation is such that an upside price target of as much as 30 is not unreasonable. Reaching such a target would represent a minimum, post-breakout gain of approximately 10%. |
Technical Writer for Technical Analysis of STOCKS & COMMODITIES magazine, Working-Money.com, and Traders.com Advantage.
| Title: | Technical Writer |
| Company: | Technical Analysis, Inc. |
| Address: | 4757 California Avenue SW |
| Seattle, WA 98116 | |
| Phone # for sales: | 206 938 0570 |
| Fax: | 206 938 1307 |
| Website: | www.Traders.com |
| E-mail address: | DPenn@traders.com |
Traders' Resource Links | |
| Charting the Stock Market: The Wyckoff Method -- Books | |
| Working-Money.com -- Online Trading Services | |
| Traders.com Advantage -- Online Trading Services | |
| Technical Analysis of Stocks & Commodities -- Publications and Newsletters | |
| Working Money, at Working-Money.com -- Publications and Newsletters | |
| Traders.com Advantage -- Publications and Newsletters | |
| Professional Traders Starter Kit -- Software | |
Click here for more information about our publications!
Comments

Request Information From Our Sponsors
- StockCharts.com, Inc.
- Candle Patterns
- Candlestick Charting Explained
- Intermarket Technical Analysis
- John Murphy on Chart Analysis
- John Murphy's Chart Pattern Recognition
- John Murphy's Market Message
- MurphyExplainsMarketAnalysis-Intermarket Analysis
- MurphyExplainsMarketAnalysis-Visual Analysis
- StockCharts.com
- Technical Analysis of the Financial Markets
- The Visual Investor
- VectorVest, Inc.
- Executive Premier Workshop
- One-Day Options Course
- OptionsPro
- Retirement Income Workshop
- Sure-Fire Trading Systems (VectorVest, Inc.)
- Trading as a Business Workshop
- VectorVest 7 EOD
- VectorVest 7 RealTime/IntraDay
- VectorVest AutoTester
- VectorVest Educational Services
- VectorVest OnLine
- VectorVest Options Analyzer
- VectorVest ProGraphics v6.0
- VectorVest ProTrader 7
- VectorVest RealTime Derby Tool
- VectorVest Simulator
- VectorVest Variator
- VectorVest Watchdog
