HOT TOPICS LIST
- MACD
- Fibonacci
- RSI
- Gann
- ADXR
- Stochastics
- Volume
- Triangles
- Futures
- Cycles
- Volatility
- ZIGZAG
- MESA
- Retracement
- Aroon
INDICATORS LIST
LIST OF TOPICS
PRINT THIS ARTICLE
by Chaitali Mohile
Copart Inc. was under strong resistance, suggesting a descending rally. But the gap-up opening on Thursday has surprised market watchers.
Position: Buy
Chaitali Mohile
Active trader in the Indian stock markets since 2003 and a full-time writer. Trading is largely based upon technical analysis.
PRINT THIS ARTICLE
GAPS
Copart Gaps Up
06/09/09 10:57:54 AMby Chaitali Mohile
Copart Inc. was under strong resistance, suggesting a descending rally. But the gap-up opening on Thursday has surprised market watchers.
Position: Buy
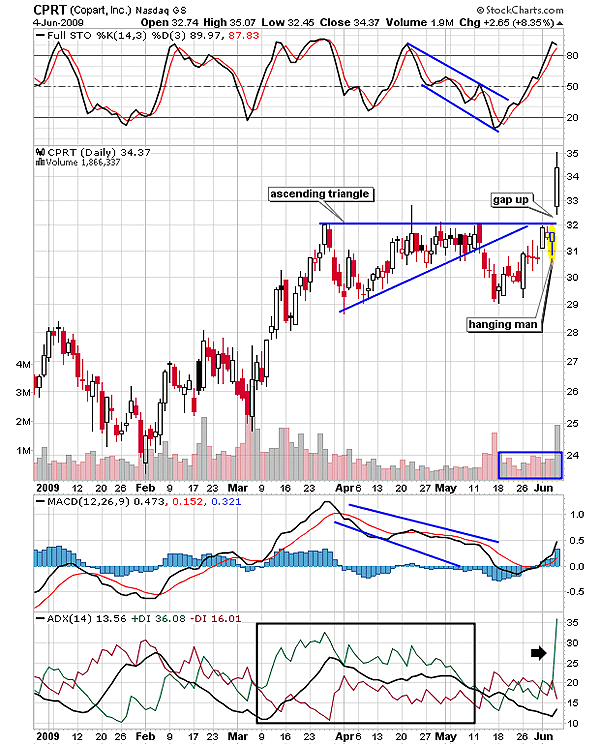
| An ascending triangle in Figure 1 of Copart Inc. (CPRT) failed as the bullish continuation pattern broke downward. The average directional movement index (ADX) (14) indicated a developing uptrend, but an advance rally from $25 failed to increase the buying pressure. As a result, the ADX (14) declined from the 25 level, indicating a weakness in the trend. Similarly, the moving average convergence/divergence (MACD) (12,26,9) retraced to the zero-line support. CPRT formed higher lows and a stable top, but the full stochastic (14,3,3) and the MACD (12,26,9) formed lower lows and lower highs, suggesting a negative divergence. These bearish indications of the momentum indicators and the ADX (14) might be the technical reasons for the bearish breakout of an ascending triangle. Although the downside rally was not deep, it whipsawed many bullish traders, anticipating an upward breakout. This breakout failure is a major reversal signal for any equity or an index. |

|
| FIGURE 1: CPRT, DAILY. An ascending triangle is shown here; a bullish continuation pattern failed as the price broke downward. Later, the price established support at the lowest point of the triangle. |
| Graphic provided by: StockCharts.com. |
| |
| The stock established support at the lowest point of the triangle at $25 and resumed the bullish move toward the seller's line (horizontal line) resistance. The volume remained calm, though the stochastic oscillator surged from an oversold level of 20. This signifies lack of confidence among traders and investors, weakening the rally. The MACD (12,26,9) moved upward with the support of the zero line, but the ADX (14) remained weak. In addition, a hanging man appeared near the resistance line at $32, indicating a minor correction. Therefore, the technical chart of CPRT was full of bearish indications. A gap-up opening is always an unpredictable event. In Figure 1, we can see that gap up on June 4 violated the resistance of the seller's line. |
| The buying pressure in the ADX (14) increased dramatically, but the trend is still weak. The MACD (12,26,9) is positive, and the full stochastic (14,3,3) is overbought. Therefore, the gap-up breakout is likely to consolidate. Traders and investors can initiate the long trade after the consolidation breakout. Trading at current levels might whipsaw them, as CPRT can consolidate at any level that is at a high or near the previous support at $32 by refilling the gap. |

|
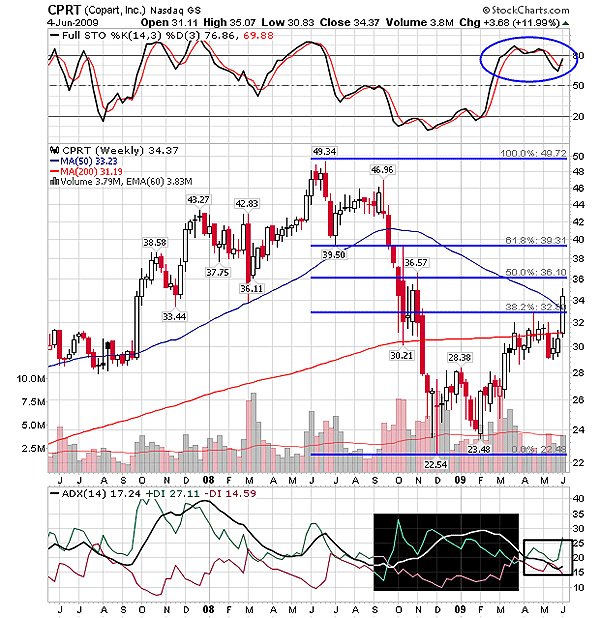
| FIGURE 2: CPRT, WEEKLY. After a gap-up opening, CPRT breached the MA resistance as well as a 38.2% retracement level. |
| Graphic provided by: StockCharts.com. |
| |
| The 200-day moving average was a major hurdle for the bullish rally in Figure 2. The Fibonacci retracement tool used shows the 38.2% level as another technical resistance for CPRT. The upper shadows of the candles reflect volatility in a weekly trading range. The full stochastic (14,3,3) in Figure 2 is shaky within an overbought territory, indicating volatility. The black block in the ADX (14) shows a declining uptrend. But the gap up opening has breached the resistance as well as the 50-day moving average resistance on the price chart. The stochastic oscillator that plunged below 70 levels is trying to resume its bullish move. The buying pressure of the ADX (14) has increased after the gap up. Therefore, CPRT is likely to regain the strength and may hit a 50% Fibonacci retracement level. The stock can rally higher if the uptrend should be developed. |
| Thus, the stock that was about to correct under the bearish technical signs swam out of the storm due to the gap-up opening. CPRT would gradually hit the previous highs. |
Active trader in the Indian stock markets since 2003 and a full-time writer. Trading is largely based upon technical analysis.
| Company: | Independent |
| Address: | C1/3 Parth Indraprasth Towers. Vastrapur |
| Ahmedabad, Guj 380015 | |
| E-mail address: | chaitalimohile@yahoo.co.in |
Traders' Resource Links | |
| Independent has not added any product or service information to TRADERS' RESOURCE. | |
Click here for more information about our publications!
PRINT THIS ARTICLE

Request Information From Our Sponsors
- VectorVest, Inc.
- Executive Premier Workshop
- One-Day Options Course
- OptionsPro
- Retirement Income Workshop
- Sure-Fire Trading Systems (VectorVest, Inc.)
- Trading as a Business Workshop
- VectorVest 7 EOD
- VectorVest 7 RealTime/IntraDay
- VectorVest AutoTester
- VectorVest Educational Services
- VectorVest OnLine
- VectorVest Options Analyzer
- VectorVest ProGraphics v6.0
- VectorVest ProTrader 7
- VectorVest RealTime Derby Tool
- VectorVest Simulator
- VectorVest Variator
- VectorVest Watchdog
- StockCharts.com, Inc.
- Candle Patterns
- Candlestick Charting Explained
- Intermarket Technical Analysis
- John Murphy on Chart Analysis
- John Murphy's Chart Pattern Recognition
- John Murphy's Market Message
- MurphyExplainsMarketAnalysis-Intermarket Analysis
- MurphyExplainsMarketAnalysis-Visual Analysis
- StockCharts.com
- Technical Analysis of the Financial Markets
- The Visual Investor
