HOT TOPICS LIST
- MACD
- Fibonacci
- RSI
- Gann
- ADXR
- Stochastics
- Volume
- Triangles
- Futures
- Cycles
- Volatility
- ZIGZAG
- MESA
- Retracement
- Aroon
INDICATORS LIST
LIST OF TOPICS
PRINT THIS ARTICLE
by Koos van der Merwe
Is it cheaper to buy online or is it the hits on the ads feeding the company? Whatever it is, this is a company worth watching.
Position: Accumulate
Koos van der Merwe
Has been a technical analyst since 1969, and has worked as a futures and options trader with First Financial Futures in Johannesburg, South Africa.
PRINT THIS ARTICLE
WEDGE FORMATIONS
United Online Worth Watching
06/08/09 12:46:32 PMby Koos van der Merwe
Is it cheaper to buy online or is it the hits on the ads feeding the company? Whatever it is, this is a company worth watching.
Position: Accumulate
| United Online (UNTD) provides consumer products and services over the Internet primarily in the US. It operates in three segments: FTD, Classmates Media, and Communications. The FTD segment provides floral and related products and services to consumers and retail florists, as well as to other retail locations offering floral and related products and services. The Classmates Media segment offers online social networking services under the Classmates name and online loyalty marketing services under the MyPoints name. It also provides international social networking services under the Trombi and StayFriends names. The Communications segment offers dialup Internet access and email under the NetZero and Juno names. It also offers broadband services, Internet security services, web hosting services, and premium email. The company also offers Internet advertising products and services, and online market research services. As of December 31, 2008, United Online had approximately 4.3 million social networking pay accounts. |

|
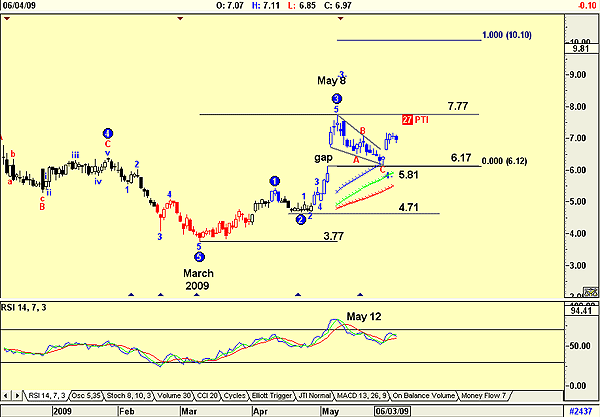
| FIGURE 1: UNTD, DAILY |
| Graphic provided by: AdvancedGET. |
| |
| Figure 1 shows that in March 2009, the stock price completed a fifth wave down and started correcting upward. The Advanced GET Elliott wave count suggests that the price is in the process of completing a fourth-wave retracement with a target of $5.81, but the PTI (probability ) of 27 is not convincing enough, which means that with the price falling to fill the gap and bouncing off the support level of the gap, $6.17 could well be a strong support level. Should this be the case, then the price could well rise to $10.10, the target of a Fibonacci extension application. There should be resistance at $7.77, the high of May 8. The chart is also showing a falling wedge, with a target of $9.23 (7.77 - 4.71 = 3.06 + 6.17 = 9.23). Both targets, namely $9.23 and $10.10, are an appreciable rise from the present price. The negative is, of course, the relative strength index (RSI), which gave a sell signal on May 12. Do remember that in December 1999, the price reached a high soon after its listing on the market of $134.10 and promptly crashed to $1.13 with the bursting of the tech bubble. By September 2003 it had recovered to a high of $28.20 before falling to a low $3.77 in March 2009. Its present upward move is a cautious one. This is a stock that can be placed on one's watchlist. Present chart movement does suggest that as the market recovers, so will the share price. |
Has been a technical analyst since 1969, and has worked as a futures and options trader with First Financial Futures in Johannesburg, South Africa.
| Address: | 3256 West 24th Ave |
| Vancouver, BC | |
| Phone # for sales: | 6042634214 |
| E-mail address: | petroosp@gmail.com |
Click here for more information about our publications!
PRINT THIS ARTICLE

Request Information From Our Sponsors
- StockCharts.com, Inc.
- Candle Patterns
- Candlestick Charting Explained
- Intermarket Technical Analysis
- John Murphy on Chart Analysis
- John Murphy's Chart Pattern Recognition
- John Murphy's Market Message
- MurphyExplainsMarketAnalysis-Intermarket Analysis
- MurphyExplainsMarketAnalysis-Visual Analysis
- StockCharts.com
- Technical Analysis of the Financial Markets
- The Visual Investor
- VectorVest, Inc.
- Executive Premier Workshop
- One-Day Options Course
- OptionsPro
- Retirement Income Workshop
- Sure-Fire Trading Systems (VectorVest, Inc.)
- Trading as a Business Workshop
- VectorVest 7 EOD
- VectorVest 7 RealTime/IntraDay
- VectorVest AutoTester
- VectorVest Educational Services
- VectorVest OnLine
- VectorVest Options Analyzer
- VectorVest ProGraphics v6.0
- VectorVest ProTrader 7
- VectorVest RealTime Derby Tool
- VectorVest Simulator
- VectorVest Variator
- VectorVest Watchdog
