HOT TOPICS LIST
- MACD
- Fibonacci
- RSI
- Gann
- ADXR
- Stochastics
- Volume
- Triangles
- Futures
- Cycles
- Volatility
- ZIGZAG
- MESA
- Retracement
- Aroon
INDICATORS LIST
LIST OF TOPICS
PRINT THIS ARTICLE
by Paolo Pezzutti
The rebound of the euro vs the US dollar could be almost over.
Position: Sell
Paolo Pezzutti
Author of the book "Trading the US Markets - A Comprehensive Guide to US Markets for International Traders and Investors" - Harriman House (July 2008)
PRINT THIS ARTICLE
ELLIOTT WAVE
Stronger Dollar Ahead?
06/05/09 02:03:35 PMby Paolo Pezzutti
The rebound of the euro vs the US dollar could be almost over.
Position: Sell
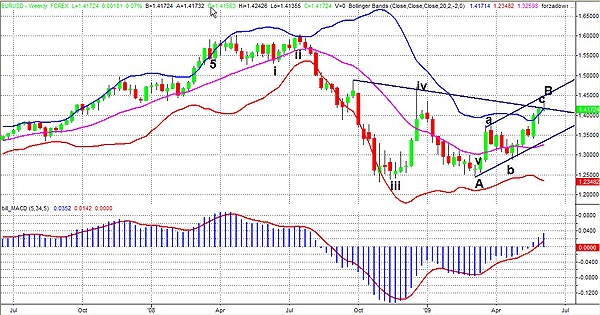
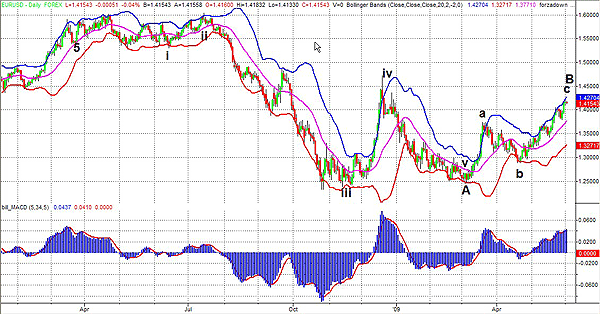
| The weekly chart of the US dollar vs the euro (EUR/USD) in Figure 1 displays an uptrend that brought prices from a low at about 0.82 in October 2000 to the high at about 1.60 in July 2008. The Elliott wave count in this time frame indicates that the five waves to the upside are completed. The subsequent move initiated in the summer of 2008 could be interpreted as the wave A of an A-B-C correction. From July to November 2008, prices developed an impulse to the downside printing the first three waves of wave A. Wave 4 was completed last February and wave 5 (the last of the corrective wave A) was completed in April. In the daily chart in Figure 2, you can see that the moving average convergence/divergence (MACD), used to help interpret the Elliott wave count, became positive when developing wave 4, supporting this interpretation. |

|
| FIGURE 1: EURUSD, WEEKLY. Prices have almost completed their rebound (wave B) after the first leg to the downside started last summer (wave A). |
| Graphic provided by: TradeStation. |
| |
| According to this approach, the EUR/USD is now developing wave B in the form of an a-b-c pattern. At the moment we are in the final wave c. That means that the rebound of the euro after the first big move to the downside of the second part of last year is almost over. When wave B is completed, we should therefore see the dollar regaining strength and develop a wave C to the downside, moving again toward the level of 1.25. |

|
| FIGURE 2: EURUSD, DAILY. You can see that wave B is formed by an a-b-c pattern. At the moment, prices are completing the last wave to the upside. |
| Graphic provided by: TradeStation. |
| |
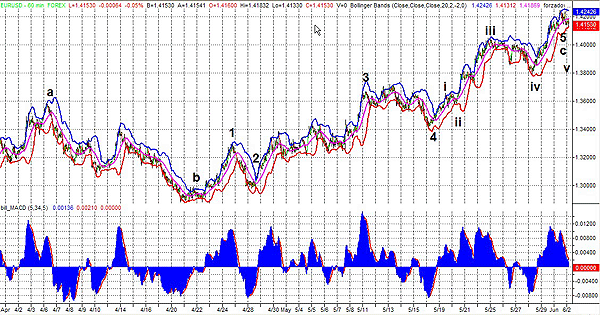
| In Figure 3, you can see the 60-minute chart. Note that wave c of B has been developing as usual in five waves. The fifth wave of these five waves can be decomposed also in five waves. At the moment, EURUSD is about to complete this fractal of a five-wave formation. This is the beauty of the Elliott count. You can observe how in each time frame the fractal of five waves in the primary trend and A-B-C in the corrective trend can be decomposed in similar fractal patterns. Of course, trading the Elliott wave is not the holy grail. As the price action develops, the count can change. However, this methodology can be useful for building the big picture and understanding the context in which you decide to open your position. |

|
| FIGURE 3: EURUSD, 60-MINUTE. The wave c of B can be decomposed fractally in five waves. Prices are printing the last of these waves. When this pattern is completed, we should see the dollar regain strength and develop another medium-erm leg to the downside. |
| Graphic provided by: TradeStation. |
| |
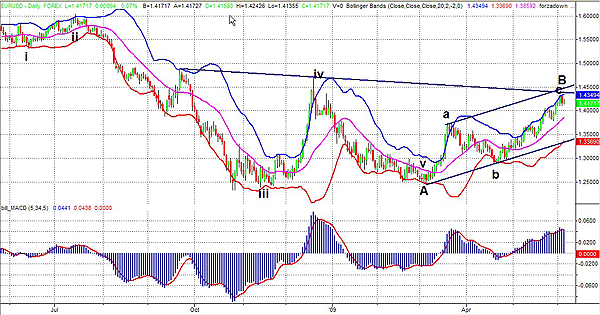
| In Figure 4, you can also see that prices are testing the descending trendline formed by the relative highs printed in September and December 2008. At the same time, they are moving within an upward channel and are very close to the upper part of the channel. |

|
| FIGURE 4: EURUSD, DAILY. Prices are testing a long-term descending trendline. They are also moving in the upper part of a rising channel. |
| Graphic provided by: TradeStation. |
| |
| In conclusion, I would not bet on the weakness of the dollar in this phase. This view is contrary to the prevalent opinions we read in the press because of the concerns related to the US deficit and possible future inflation. Looking at the big picture, after a long rally of equities and oil, associated to a significant correction of Treasuries, I would now expect a medium-term reversal of the trends, including the one of the US dollar. |
Author of the book "Trading the US Markets - A Comprehensive Guide to US Markets for International Traders and Investors" - Harriman House (July 2008)
| Address: | VIA ROBERTO AGO 26 POSTAL CODE 00166 |
| Rome, ITALY | |
| Phone # for sales: | +393357540708 |
| E-mail address: | pezzutti.paolo@tiscali.it |
Click here for more information about our publications!
Comments
Date: 06/09/09Rank: 5Comment:
Date: 06/09/09Rank: 4Comment:

Request Information From Our Sponsors
- StockCharts.com, Inc.
- Candle Patterns
- Candlestick Charting Explained
- Intermarket Technical Analysis
- John Murphy on Chart Analysis
- John Murphy's Chart Pattern Recognition
- John Murphy's Market Message
- MurphyExplainsMarketAnalysis-Intermarket Analysis
- MurphyExplainsMarketAnalysis-Visual Analysis
- StockCharts.com
- Technical Analysis of the Financial Markets
- The Visual Investor
- VectorVest, Inc.
- Executive Premier Workshop
- One-Day Options Course
- OptionsPro
- Retirement Income Workshop
- Sure-Fire Trading Systems (VectorVest, Inc.)
- Trading as a Business Workshop
- VectorVest 7 EOD
- VectorVest 7 RealTime/IntraDay
- VectorVest AutoTester
- VectorVest Educational Services
- VectorVest OnLine
- VectorVest Options Analyzer
- VectorVest ProGraphics v6.0
- VectorVest ProTrader 7
- VectorVest RealTime Derby Tool
- VectorVest Simulator
- VectorVest Variator
- VectorVest Watchdog
