HOT TOPICS LIST
- MACD
- Fibonacci
- RSI
- Gann
- ADXR
- Stochastics
- Volume
- Triangles
- Futures
- Cycles
- Volatility
- ZIGZAG
- MESA
- Retracement
- Aroon
INDICATORS LIST
LIST OF TOPICS
PRINT THIS ARTICLE
by Chaitali Mohile
After two years, the Health Care Provider Index has entered a fresh intermediate uptrend. The confirmed triangular breakout would polish the bullish path for the index.
Position: Buy
Chaitali Mohile
Active trader in the Indian stock markets since 2003 and a full-time writer. Trading is largely based upon technical analysis.
PRINT THIS ARTICLE
BREAKOUTS
Breakout Of Health Care Index
06/05/09 01:27:45 PMby Chaitali Mohile
After two years, the Health Care Provider Index has entered a fresh intermediate uptrend. The confirmed triangular breakout would polish the bullish path for the index.
Position: Buy
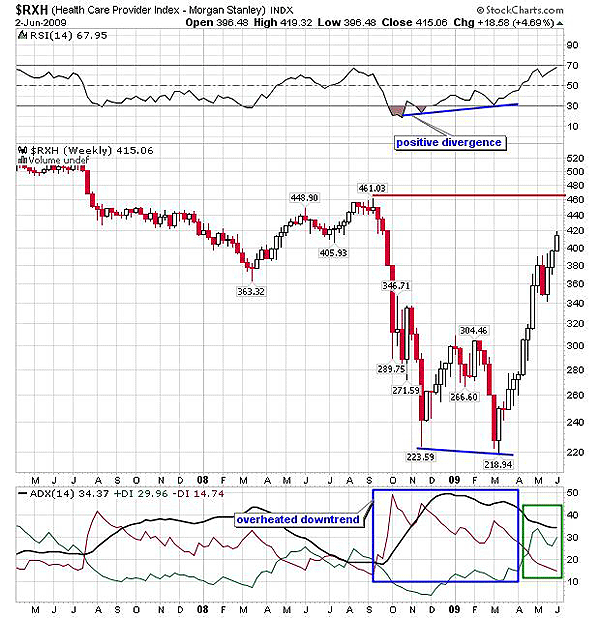
| The Health Care Provider Index ($RXH) formed lower highs at 223 and 218 in November 2008 and March 2009. These two lows can be considered to be a double bottom, as there is only a marginal difference between them. Therefore, the bullish rally that was initiated after the double-bottom formation was a major trend reversal move. In Figure 1, the overheated average directional index (ADX) (14) declined and fresh buying pressure initiated a new uptrend. In addition, the relative strength index (RSI) (14) formed higher bottoms against the lower lows of the price. This positive divergence was the first bullish reversal indication on the weekly chart in Figure 1. The large candles show the bullish strength, and the small candles with long legs indicate the consolidation that helped the bullish rally climb higher. |
| The previous high of 461 is the resistance for the current rally. The developed uptrend and the bullish RSI (14) signify a stable move toward the resistance. In the current week, $RXH may remain range-bound between 400 and 420 but later would continue its upward journey. Although the RSI (14) has never surged above 70 levels in Figure 1, the existing positive momentum would stabilize the indicator in an overbought territory. |

|
| FIGURE 1: $RXH, WEEKLY. The double-bottom formation reversed the downtrend and initiated the fresh bullish move for the index. The previous high of 461 is the long-term target of the upward rally. |
| Graphic provided by: StockCharts.com. |
| |
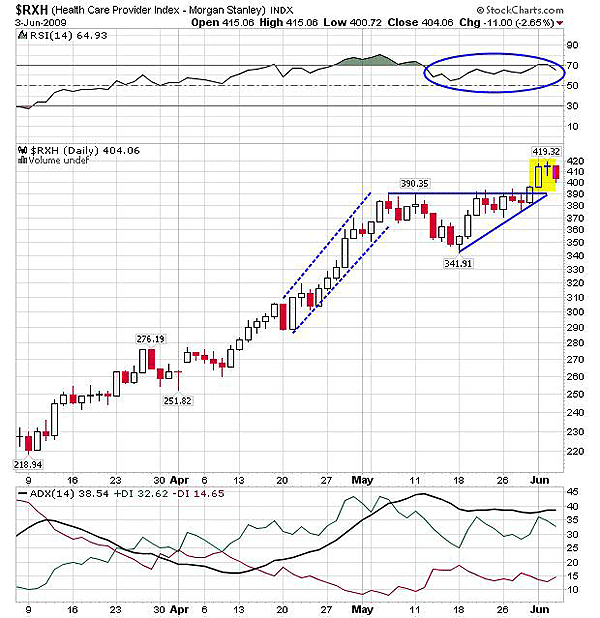
| An ascending triangle in Figure 2 is a bullish continuation pattern. The triangle is formed after an extensive advance rally; therefore, for some traders, the pattern can be a bullish pennant as well. Since both patterns are a continuation of a prior bullish action, the breakout is essentially in an upward direction. According to Figure 2, $RXH has already broken upward. However, the breakout can be confirmed only if the index sustains above the newly formed support at a seller's line of an ascending triangle. We can see that after the bullish breakout formed on June 1, a doji and a bearish candle was formed. Hence, we can anticipate a few bearish days that can retrace $RXH to a newly formed support at 390 levels. |

|
| FIGURE 2: $RXH, DAILY. The bullish breakout of an ascending triangle has to be confirmed. The index is likely to retrace at a newly formed support. |
| Graphic provided by: StockCharts.com. |
| |
| The ADX (14) is indicating a well-developed uptrend. But the RSI (14) is declining under the resistance of 70 levels; in other words, the indicator is reluctant to shift in a highly overbought area. As a result, the oscillator might become volatile in a narrow range of 50 and 70, and the price would move back to the new support. Therefore, the breakout should be reconfirmed before initiating any bullish positions. |
| Thus, $RXH would hit the previous resistance of 461 after the confirmed breakout. The target on an ascending triangle breakout can be measured as 390 - 342 = 48 + 390 = 438. According to the weekly time frame, 461 is a long-term target, but for short-term traders the minimum estimated level on breakout would be 438. |
Active trader in the Indian stock markets since 2003 and a full-time writer. Trading is largely based upon technical analysis.
| Company: | Independent |
| Address: | C1/3 Parth Indraprasth Towers. Vastrapur |
| Ahmedabad, Guj 380015 | |
| E-mail address: | chaitalimohile@yahoo.co.in |
Traders' Resource Links | |
| Independent has not added any product or service information to TRADERS' RESOURCE. | |
Click here for more information about our publications!
PRINT THIS ARTICLE

Request Information From Our Sponsors
- StockCharts.com, Inc.
- Candle Patterns
- Candlestick Charting Explained
- Intermarket Technical Analysis
- John Murphy on Chart Analysis
- John Murphy's Chart Pattern Recognition
- John Murphy's Market Message
- MurphyExplainsMarketAnalysis-Intermarket Analysis
- MurphyExplainsMarketAnalysis-Visual Analysis
- StockCharts.com
- Technical Analysis of the Financial Markets
- The Visual Investor
- VectorVest, Inc.
- Executive Premier Workshop
- One-Day Options Course
- OptionsPro
- Retirement Income Workshop
- Sure-Fire Trading Systems (VectorVest, Inc.)
- Trading as a Business Workshop
- VectorVest 7 EOD
- VectorVest 7 RealTime/IntraDay
- VectorVest AutoTester
- VectorVest Educational Services
- VectorVest OnLine
- VectorVest Options Analyzer
- VectorVest ProGraphics v6.0
- VectorVest ProTrader 7
- VectorVest RealTime Derby Tool
- VectorVest Simulator
- VectorVest Variator
- VectorVest Watchdog
