HOT TOPICS LIST
- MACD
- Fibonacci
- RSI
- Gann
- ADXR
- Stochastics
- Volume
- Triangles
- Futures
- Cycles
- Volatility
- ZIGZAG
- MESA
- Retracement
- Aroon
INDICATORS LIST
LIST OF TOPICS
PRINT THIS ARTICLE
by Chaitali Mohile
The S&P 500 has surged above the consolidation range. The index is likely to hit previous highs after the breakout.
Position: Buy
Chaitali Mohile
Active trader in the Indian stock markets since 2003 and a full-time writer. Trading is largely based upon technical analysis.
PRINT THIS ARTICLE
BREAKOUTS
S&P 500 Is Healthy And Bullish
06/03/09 12:44:21 PMby Chaitali Mohile
The S&P 500 has surged above the consolidation range. The index is likely to hit previous highs after the breakout.
Position: Buy
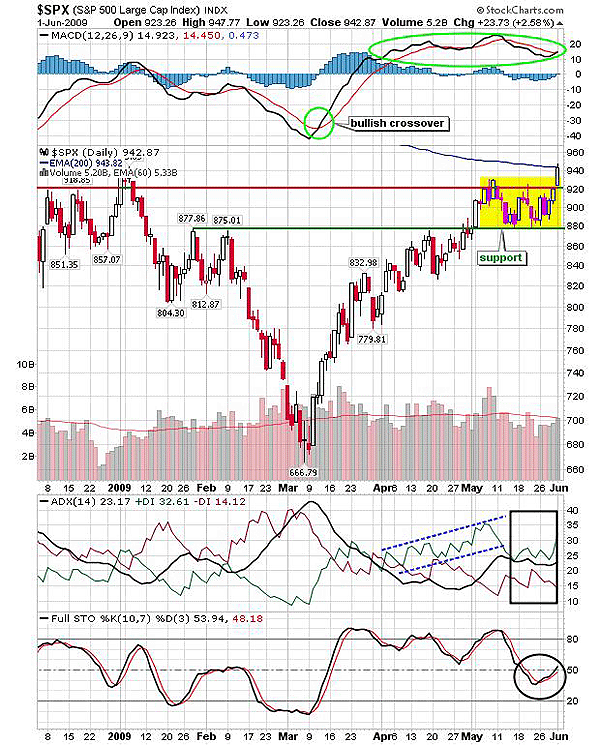
| After the V-shaped recovery from 666 levels, the S&P 500 Large Cap Index ($SPX) consolidated in May 2009. The bullish rally was suppressed under the strong resistance of previous highs at 920 levels. During an upward move, the resistance at 877 levels was converted to the support zone for the consolidation. In Figure 1 the volume was encouraging due to wide-range price action. Although the trend as indicated by the average directional movement index (ADX) (14) was weak, the buying pressure surged along with the price. The dotted upward channel in ADX (14) in Figure 1 shows an increased buying pressure. Gradually, the trend indicator moved above 20 levels, indicating a developing bullish trend. The consolidation period allowed the trend to gain further bullish strength, and therefore, ADX (14) turned stronger. |

|
| FIGURE 1: $SPX, DAILY. The index consolidated for a month in a wide range of 920 and 880. The bullish breakout would sustain due to the bullish indicators. |
| Graphic provided by: StockCharts.com. |
| |
| $SPX established support at the previous highs at 880 levels (see the green line in Figure 1) and moved sideways. The support-resistance tool in Figure 1 shows robust resistance at 920 levels. As a result, $SPX rally changed its direction by moving horizontally. The moving average convergence/divergence (MACD) (12,26,9) after a bullish crossover in negative territory broke upward and established support above the zero line. The full stochastic (10,7,3) rallied in an overbought zone of 60 to 80 during the consolidation but remained healthily bullish. On these bullish notes, $SPX broke an upper range of consolidation. The recent breakout of the large-cap index is likely to ignite a future bullish rally in the broader market and other major indexes. |
| The ADX (14) is indicating the developing uptrend at the 25 level, the MACD (12,26,9) is positive above the zero line, and the full stochastic (10,7,3) at 50 is suggesting fresh buying opportunity for traders and investors. Although the 200-day moving average (MA) is an immediate resistance, the positive indicators would violate this resistance. |

|
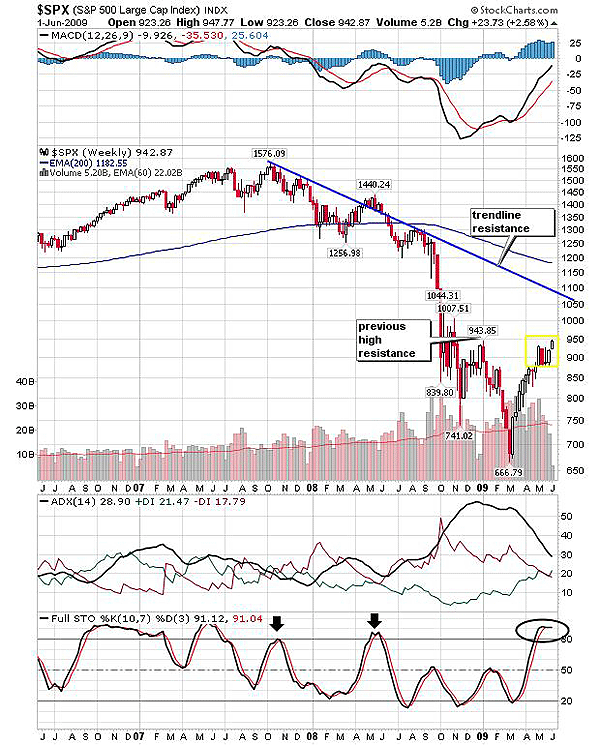
| FIGURE 2: $SPX, WEEKLY. The trendline shows the resistance at 1050 levels for the current breakout rally. The flat stochastic suggests stability of the bullish move. The declining ADX (14) from an overheated downtrend area encouraged upward rally. |
| Graphic provided by: StockCharts.com. |
| |
| The weekly chart in Figure 2 shows the exact previous high-resistance 943 levels. The consolidation at this resistance has formed a short-term bullish flag & pennant continuation pattern in Figure 2. The recent breakout is ready to shoot the trendline target. The declining trendline drawn connecting the lower highs shows the resistance at 1050, and therefore, $SPX would undergo a 100-point breakout rally. The stochastic oscillator is flat in an overbought area, suggesting a bullish move. Earlier, the indicator plunged from the same area; see the arrows in Figure 2, in that currently the stochastic is indicating bullish momentum toward the breakout rally. |
| Thus, traders can enter fresh long positions with the target of 1050. The breakout in $SPX is considered important even for other US indexes as well as for global financial markets. |
Active trader in the Indian stock markets since 2003 and a full-time writer. Trading is largely based upon technical analysis.
| Company: | Independent |
| Address: | C1/3 Parth Indraprasth Towers. Vastrapur |
| Ahmedabad, Guj 380015 | |
| E-mail address: | chaitalimohile@yahoo.co.in |
Traders' Resource Links | |
| Independent has not added any product or service information to TRADERS' RESOURCE. | |
Click here for more information about our publications!
PRINT THIS ARTICLE

Request Information From Our Sponsors
- StockCharts.com, Inc.
- Candle Patterns
- Candlestick Charting Explained
- Intermarket Technical Analysis
- John Murphy on Chart Analysis
- John Murphy's Chart Pattern Recognition
- John Murphy's Market Message
- MurphyExplainsMarketAnalysis-Intermarket Analysis
- MurphyExplainsMarketAnalysis-Visual Analysis
- StockCharts.com
- Technical Analysis of the Financial Markets
- The Visual Investor
- VectorVest, Inc.
- Executive Premier Workshop
- One-Day Options Course
- OptionsPro
- Retirement Income Workshop
- Sure-Fire Trading Systems (VectorVest, Inc.)
- Trading as a Business Workshop
- VectorVest 7 EOD
- VectorVest 7 RealTime/IntraDay
- VectorVest AutoTester
- VectorVest Educational Services
- VectorVest OnLine
- VectorVest Options Analyzer
- VectorVest ProGraphics v6.0
- VectorVest ProTrader 7
- VectorVest RealTime Derby Tool
- VectorVest Simulator
- VectorVest Variator
- VectorVest Watchdog
