HOT TOPICS LIST
- MACD
- Fibonacci
- RSI
- Gann
- ADXR
- Stochastics
- Volume
- Triangles
- Futures
- Cycles
- Volatility
- ZIGZAG
- MESA
- Retracement
- Aroon
INDICATORS LIST
LIST OF TOPICS
PRINT THIS ARTICLE
by Ron Walker
A muscular breakout on the DJIA at the opening of June has carried prices into smack-dab into a hornet's nest of resistance. If this industrial powerhouse bulks up and presses prices through these heavy weights of resistance, the DJIA could continue to the 9100 level. If not, and resistance holds, it may bring about a deadly blow that kills this rally, ushering in a correction.
Position: N/A
Ron Walker
Ron Walker is an active trader and technical analyst. He operates an educational website dedicated to the study of Technical Analysis. The website offers free market analysis with daily video presentations and written commentaries. Ron is a video pioneer, being one of the first to utilize the internet producing Technical Analysis videos. His website is thechartpatterntrader.com
PRINT THIS ARTICLE
BREAKOUTS
The DJIA Breakout Collides Into Resistance
06/03/09 10:24:27 AMby Ron Walker
A muscular breakout on the DJIA at the opening of June has carried prices into smack-dab into a hornet's nest of resistance. If this industrial powerhouse bulks up and presses prices through these heavy weights of resistance, the DJIA could continue to the 9100 level. If not, and resistance holds, it may bring about a deadly blow that kills this rally, ushering in a correction.
Position: N/A
| The Dow Jones Industrial Avererage (DJIA) has been lagging most other major indexes, due to problems associated to certain Dow components such as General Motors and Citigroup (C). The Dow Jones editorial board, which oversees the DJIA, has chosen Cisco Systems (CSCO) and Travelers (TRV) to be substituted into the Dow 30 in place of GM and Citigroup. GM recently drove into bankruptcy, resulting in it being removed from the list, while Citigroup was removed due to its restructuring. |

|
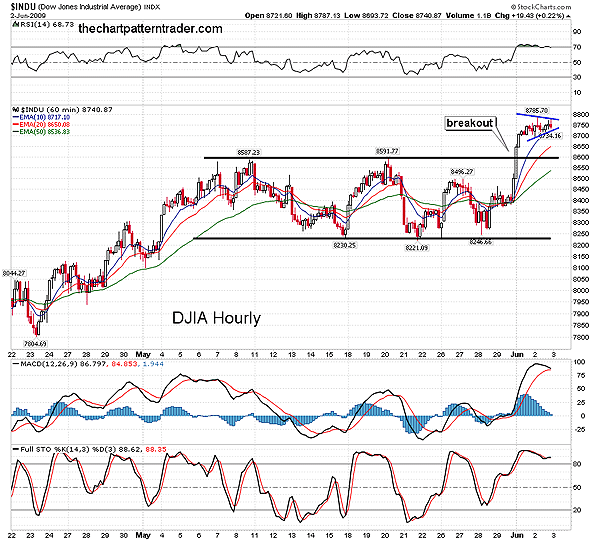
| FIGURE 1: DJIA, HOURLY. The DJIA formulated a base in May, breaking out in early June. A continuation pattern formed as a pennant, but with an extended MACD, we may see the prices shift into backtest mode. Key support is now at the 8575-8600 area. |
| Graphic provided by: StockCharts.com. |
| |
| A consolidation throughout May had the DJIA hourly chart (Figure 1) stuck in a rut, moving in a narrow trading range between 8221 to 8591. The bulls and bears were in a standoff until prices finally broke out from that base on the first trading session in June. The DJIA hourly chart shows prices surging above the pivot point, which was just below the 8600 area. The DJIA should find support at the 8575-8600 area on any backtest move. If prices backtest and find support at the upper boundary of the rectangle base and then rise back up and exceed the current price levels, it may be the catalyst that cuts through a clutter of resistance. This breakout has taken on new importance in conjunction with its daily and weekly charts, parking prices in front of a variable feature of resistance, the 200-day simple moving average on the daily chart, and the primary trendline on the weekly chart. This forceful entry into resistance has stalled the advance as another consolation takes place on the hourly chart in the form of a pennant. With significant resistance hovering over the DJIA, we must respect both pivot points on this miniature pennant pattern, realizing that prices could be setting up a continuation pattern or a reversal. |

|
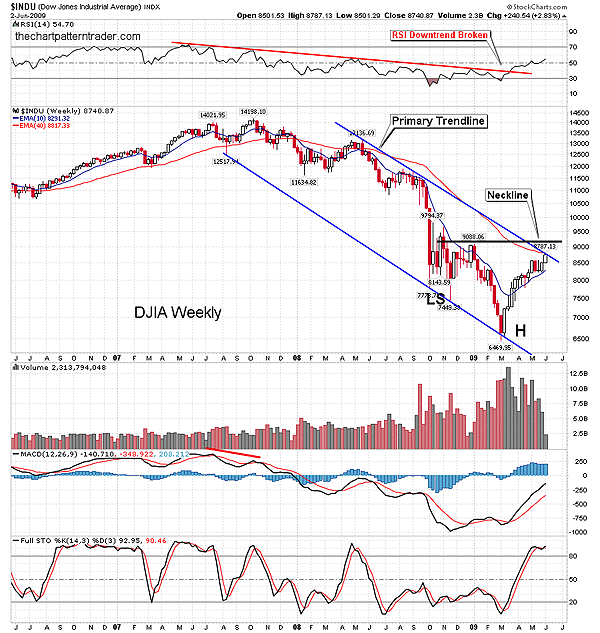
| FIGURE 2: DJIA, WEEKLY. The weekly chart fully discloses the amount that resistance prices are up against. Note the potential inverted head & shoulders pattern. A breakout of the falling price channel would choreograph nicely with this massive reversal pattern. Look for the relative strength index (RSI) to put in a higher low after the next correction. That may produce a shoulder. |
| Graphic provided by: StockCharts.com. |
| |
| The weekly chart in Figure 2 reveals that the DJIA may have a struggle getting over its primary trendline. But if it can rise above this hurdle, that would translate into higher prices for the DJIA and open the door for a test to horizontal resistance at the January high of 9088. That peak serves as a potential neckline for an extremely large inverse head & shoulders pattern. Should prices climb above the primary downward trendline, they may tag that neckline and then reverse hard to form a right shoulder during the summer. Momentum lows for a right shoulder might be contained at similar levels that formed the left shoulder during the November 2008 lows near 7450 or just above 8000 (assuming that we exclude the long lower shadow on the weekly candlestick that formed the November 2008 lows). In contrast, a collision with the trendline may cause tremendous damage to the advance. And that might be the tipping point that results in a sharp reversal as the bears patiently wait to pounce on the DJIA. In uncertain times, it is very important to correlate multiple time frames after an excessive price run in order to find potential areas of support and resistance. |

|
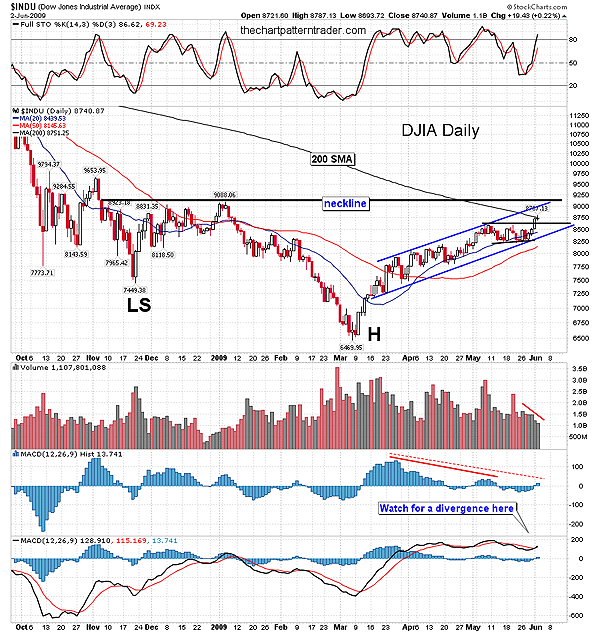
| FIGURE 3: DJIA, DAILY. Here the DJIA tagged the 200-day SMA, but there is still more upside potential. Prices haven't retested the upper boundary of the channel, nor have they tested the January peak yet just below 9100. |
| Graphic provided by: StockCharts.com. |
| |
| The DJIA daily chart (Figure 3) reveals that the breakout came on rather light volume, leaving many traders unpersuaded to the legitimacy of this recent breakout. There is the possibility that a bearish divergence is forming on the moving average convergence/divergence (MACD) (12, 26, 9). The MACD would need to put in a lower peak here, as prices remain at new highs or even by continuing higher. The breakout has moved the MACD histogram above the zero line, but if it fails to exceed the previous histogram tower, it may quickly turn back below the zero line, and thus continue the down trendline on the histogram of successive lower peaks. But it is blatantly obvious that the DJIA hasn't touched the upper boundary (rising resistance) of its channel on the daily chart. Ironically, that upper trendline is pointing to the neckline from the January high at 9088. The stochastic (14, 3, 3) became newly overbought at the price breakout, overriding the weak volume trends for now. |
| In conclusion, as long as prices continue to find support at the 20-day simple moving average (SMA), the advance on the daily chart will continue. Until we see lower lows being made on the daily chart, we should be cautiously optimistic that the breakout above the 8600 level is legitimate and will ultimately result in a test of 9088. If prices begin to weaken, they must hold above the rising trendline near the 8575 level. In Figure 3, the rising daily trendline beautifully intersects with the lower boundary of the rising channel with the 20-day SMA just underneath that level, showing a confluence of support at 8600. |
Ron Walker is an active trader and technical analyst. He operates an educational website dedicated to the study of Technical Analysis. The website offers free market analysis with daily video presentations and written commentaries. Ron is a video pioneer, being one of the first to utilize the internet producing Technical Analysis videos. His website is thechartpatterntrader.com
| Website: | thechartpatterntrader.com |
| E-mail address: | thechartpatterntrader@gmail.com |
Click here for more information about our publications!
Comments
Date: 06/04/09Rank: 5Comment:

Request Information From Our Sponsors
- StockCharts.com, Inc.
- Candle Patterns
- Candlestick Charting Explained
- Intermarket Technical Analysis
- John Murphy on Chart Analysis
- John Murphy's Chart Pattern Recognition
- John Murphy's Market Message
- MurphyExplainsMarketAnalysis-Intermarket Analysis
- MurphyExplainsMarketAnalysis-Visual Analysis
- StockCharts.com
- Technical Analysis of the Financial Markets
- The Visual Investor
- VectorVest, Inc.
- Executive Premier Workshop
- One-Day Options Course
- OptionsPro
- Retirement Income Workshop
- Sure-Fire Trading Systems (VectorVest, Inc.)
- Trading as a Business Workshop
- VectorVest 7 EOD
- VectorVest 7 RealTime/IntraDay
- VectorVest AutoTester
- VectorVest Educational Services
- VectorVest OnLine
- VectorVest Options Analyzer
- VectorVest ProGraphics v6.0
- VectorVest ProTrader 7
- VectorVest RealTime Derby Tool
- VectorVest Simulator
- VectorVest Variator
- VectorVest Watchdog
