HOT TOPICS LIST
- MACD
- Fibonacci
- RSI
- Gann
- ADXR
- Stochastics
- Volume
- Triangles
- Futures
- Cycles
- Volatility
- ZIGZAG
- MESA
- Retracement
- Aroon
INDICATORS LIST
LIST OF TOPICS
PRINT THIS ARTICLE
by Donald W. Pendergast, Jr.
Tupperware may not be involved in the most glamorous of businesses, but apparently many traders and investors see the stock as a great place to put their trading capital.
Position: Accumulate
Donald W. Pendergast, Jr.
Donald W. Pendergast is a financial markets consultant who offers specialized services to stock brokers and high net worth individuals who seek a better bottom line for their portfolios.
PRINT THIS ARTICLE
BREAKOUTS
Tupperware Snaps Higher On Breakout Move
06/03/09 12:11:13 PMby Donald W. Pendergast, Jr.
Tupperware may not be involved in the most glamorous of businesses, but apparently many traders and investors see the stock as a great place to put their trading capital.
Position: Accumulate
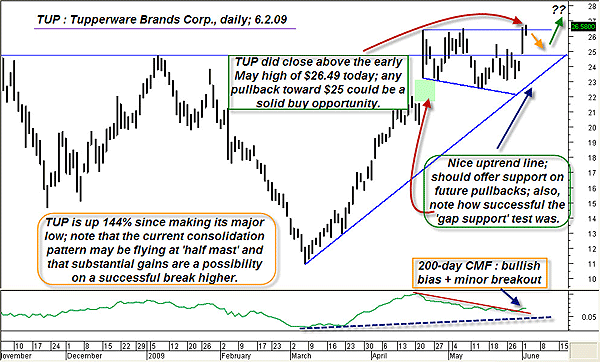
| Tupperware is a common household-product name, one that most Americans are familiar with -- you've probably even got some week-old spaghetti tucked away in the fridge in a user-friendly plastic storage container, just like everybody else. While the company's products aren't high-tech, flashy, or able to work wonders (like the imaginary cell phone that according to the late George Carlin, "could do everything, including make pancakes for you"), the company makes a decent profit, its earnings growth rate is increasing, it pays a decent dividend (3.33%), and best of all for investors, its stock is on a tear. Even more interesting for traders is the fresh (albeit minor) bullish breakout of the stock from a substantial consolidation pattern. Let's have a look at TUP's daily graph (Figure 1), one absolutely loaded with technical clues, cues, and other good stuff. |

|
| FIGURE 1: TUP, DAILY. Even though TUP is up 144% in three months, the famous "flag flying at half-mast" pattern on its daily chart might very well mean that more significant gains are possible in the days to come. |
| Graphic provided by: MetaStock. |
| |
| The most prominent feature of TUP's daily chart landscape is its massive 144% rise since making a major low (along with the rest of the US broad markets) on March 6, 2009. In the wake of the reversal move higher, a solid uptrend line has formed, and although it will undoubtedly merge with TUP's daily price bars in the future, for now, this uptrend looks like it can run even higher. That's due in no small part to the emerging breakout move from a large consolidation pattern that actually resembles the proverbial flag-on-a-pole formation that traders are always on the lookout for. As has been mentioned several times in past Traders.com Advantage articles, the old trader's legend has it that such flag formations typically "fly at half mast," meaning that substantially price gains are possible on a successful break higher from such a consolidation pattern. Other technicals that suggest the stage has been set for more gains include the very bullish 200-day Chaikin money flow (CMF) (200) trend and the successful price gap support test (the lower portion of the consolidation constituted that particular support test). Also notable is the fact that the horizontal resistance line that stretches across the top portion of chart (initiated by the January 2009 swing high) actually bisects the current consolidation into halves. It's amazing how this resistance line actually meets the major uptrend line, forming a doubly significant zone of potential future price support, too. While it's uncertain whether TUP will extend its already impressive gains should today's minor breakout move gain traction, the odds definitely favor some sort of a continuation move, given the overall trend direction and strength of the broad market indexes and that of TUP's weekly cyclical indicators, which we will examine next. |

|
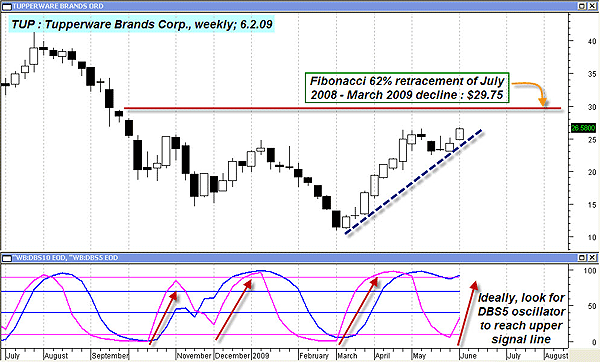
| FIGURE 2: TUP, WEEKLY. On the weekly time frame, TUP appears to have made a convincing bullish continuation move up from its trendline, with weekly cyclical oscillators confirming. Note the Fibonacci 62% resistance just below $30. |
| Graphic provided by: MetaStock. |
| Graphic provided by: Various indicators from ProfitTrader for MetaStock. |
| |
| TUP's weekly chart (Figure 2) is very basic, but it provides enough confirmation to help those planning to go long TUP on a further breakout (or on a pullback toward daily support). The pink line at the bottom of the chart is the WB EOD DBS5 indicator, one that roughly tracks the half cycle of the more dominant 20-week price cycle (measured from swing low to swing low) that occurs in many stocks and stock indexes. This indicator tends to catch the shorter-term swings with a high degree of accuracy, and since TUP is now reversing higher from its weekly uptrend line (with the WB EOD DBS5 indicator confirming the move higher), this weekly chart provides daily-based TUP traders with a high degree of confidence, should they be planning a long entry soon. Realize that the WB EOD DBS5 oscillator is a very short-term cyclical tool, and be aware of the major Fibonacci resistance that resides overhead near $29.75. Daily-based traders should be looking to take some partial profits and/or trailing a closer stop if that particular price level is reached with the short-term DBS5 oscillator near its upper signal line. |
| Playing TUP on the daily chart might be as simple as buying half a position on a pullback toward $25 (a major support zone, as mentioned), adding the second half on a continuation move higher near $26.50 to $26.75. Longer-term traders, those impressed with TUP's trend characteristics, might consider a covered call trade, too, but in reality, the level of implied volatility (IV) in TUP's call options isn't favorable for option selling right now. There's just too much risk that IV could spike higher, causing unnecessary headaches for covered call sellers. Whichever way you choose to play this setup, Tupperware shares do appear to be on the verge of further gains, offering skillful traders the chance to lock in some fresh profits. |
Donald W. Pendergast is a financial markets consultant who offers specialized services to stock brokers and high net worth individuals who seek a better bottom line for their portfolios.
| Title: | Writer, market consultant |
| Company: | Linear Trading Systems LLC |
| Jacksonville, FL 32217 | |
| Phone # for sales: | 904-239-9564 |
| E-mail address: | lineartradingsys@gmail.com |
Traders' Resource Links | |
| Linear Trading Systems LLC has not added any product or service information to TRADERS' RESOURCE. | |
Click here for more information about our publications!
PRINT THIS ARTICLE

Request Information From Our Sponsors
- StockCharts.com, Inc.
- Candle Patterns
- Candlestick Charting Explained
- Intermarket Technical Analysis
- John Murphy on Chart Analysis
- John Murphy's Chart Pattern Recognition
- John Murphy's Market Message
- MurphyExplainsMarketAnalysis-Intermarket Analysis
- MurphyExplainsMarketAnalysis-Visual Analysis
- StockCharts.com
- Technical Analysis of the Financial Markets
- The Visual Investor
- VectorVest, Inc.
- Executive Premier Workshop
- One-Day Options Course
- OptionsPro
- Retirement Income Workshop
- Sure-Fire Trading Systems (VectorVest, Inc.)
- Trading as a Business Workshop
- VectorVest 7 EOD
- VectorVest 7 RealTime/IntraDay
- VectorVest AutoTester
- VectorVest Educational Services
- VectorVest OnLine
- VectorVest Options Analyzer
- VectorVest ProGraphics v6.0
- VectorVest ProTrader 7
- VectorVest RealTime Derby Tool
- VectorVest Simulator
- VectorVest Variator
- VectorVest Watchdog
