

HOT TOPICS LIST
- MACD
- Fibonacci
- RSI
- Gann
- ADXR
- Stochastics
- Volume
- Triangles
- Futures
- Cycles
- Volatility
- ZIGZAG
- MESA
- Retracement
- Aroon
INDICATORS LIST
LIST OF TOPICS
PRINT THIS ARTICLE
by Donald W. Pendergast, Jr.
After a month of sideways price action, the broad US stock indexes have finally tipped their hand, breaking higher on big volume and wide ranges.
Position: Accumulate
Donald W. Pendergast, Jr.
Donald W. Pendergast is a financial markets consultant who offers specialized services to stock brokers and high net worth individuals who seek a better bottom line for their portfolios.
PRINT THIS ARTICLE
BREAKOUTS
Broad US Markets Break Higher From Consolidation
06/02/09 08:59:20 AMby Donald W. Pendergast, Jr.
After a month of sideways price action, the broad US stock indexes have finally tipped their hand, breaking higher on big volume and wide ranges.
Position: Accumulate
| For the past month, professional market timers as well as novice traders and investors have been pulling their hair out, trying to determine if the major US stock indexes were topping out in preparation for a corrective move lower, or if they were simply catching their breath after having risen like the legendary phoenix from the ashes of the 2007-09 stock market wipeout. Traders and investors got the answer they were so diligently inquiring for on June 1, 2009, when the Russell 2000 and Standard & Poor's 500 indexes broke higher from month-long pennant formations on their daily charts. We'll look at a unique composite daily chart first, one constructed from equal weightings of the S&P 500 and Russell 2000, to see what price levels these market indexes may be destined to achieve in the days and weeks to come. |
|
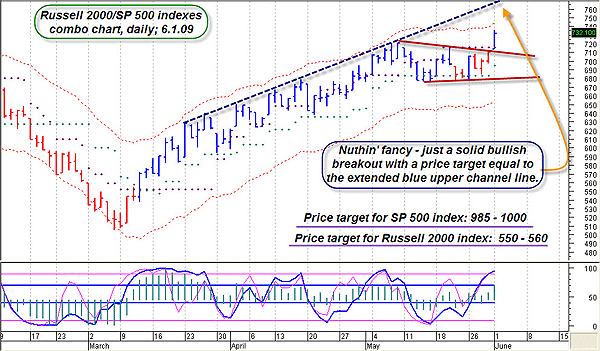
| FIGURE 1: COMBO CHART, DAILY. While it isn't always this obvious, that blue upper channel line certainly appears to be the logical initial target for this major daily breakout move. |
| Graphic provided by: MetaStock. |
| Graphic provided by: WB DBS10 EOD from ProfitTrader for MetaStock. |
| |
| Figure 1 is that composite daily chart; it's a great way to synthesize the price action of both small-cap (Russell 2000) and large-cap (S&P 500) stocks into one easy-to-use daily graph in MetaStock. The reason why this is so helpful is simple; when the combined price action of both indexes is overwhelmingly bullish or bearish, you can be pretty sure that the market move in question is broad-based, carrying the entire US stock market along with it. The obvious bullish breakout from the lovely pennant formation should lay aside all doubts about the power behind this move. Extending the upper channel line (dashed blue line) is the most logical way to project a reasonable price target for the breakout; on this composite chart the upper target is approximately 775, but of course unless you can create your own custom MetaStock index, this isn't much use to you right now, so here are the upper channel price targets for the Russell 2000 and S&P 500: Russell 2000 index: 550-560 S&P 500 index: 985-1000 If you'll recall, last week I put out an article stating that major Fibonacci resistance on the S&P 500 exists near 960 and then 990, so given the apparent force behind today's breakout, a close beyond 960 should make a potential runup to 990 look like child's play. In addition and equally bullish is the fact that the monthly and quarterly price cycles (not shown) for both indexes are also biased toward the bullish side of the map. In fact, the quarterly price cycles are very close to issuing a major buy signal, so we may yet witness one of the rarest of events -- a sustained period of bullish gains in the broad US market indexes. |
|
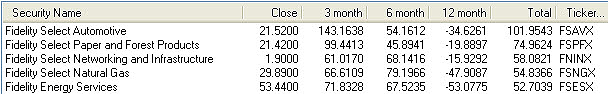
| FIGURE 2: FIDELITY SELECT SECTOR, TOP FIVE MUTUAL FUNDS. The top five Fidelity Select Sector mutual funds for June 1, 2009, based on three-, six-, and 12-month performance figures. The component stocks from these funds could also be attractive places to deploy trading capital on daily pullback moves to support. |
| Graphic provided by: MetaStock. |
| |
| Finally, here's a look at the strongest Fidelity Select Sector mutual funds (Figure 2); deploying cash into the strongest of these (or their exchange traded funds [ETF] equivalents) might make a lot of sense for those seeking to milk a sustained bullish move for all its worth. Topping the list for best intermediate- to long-term relative strength is Fidelity Select Automotive (FSAVX), followed by the Fidelity Select Paper and Forest Products (FSPFX), Fidelity Select Networking and Infrastructure (FNINX), Fidelity Select Natural Gas (FSNGX), and Fidelity Energy Services (FSESX). Here are some of the component stock tickers for each of these Fidelity funds, for those of you who prefer to trade specific stocks rather than sector funds: FSAVX: JCI, HOG,BWI, GT, HDI FSPFX: WY, SEE, TIN, RKT, SON FNINX: BRCM, JNPR, MRVL, CSCO, GOOG, SYMC FSNGX: RRC, DNR, KWK, CHK, WFT FSESX: HAL, RIG, SLB, NOV, NBL, BHI It may be wise to wait for pullbacks on daily charts if attempting to time entries on any of these stocks; alternatively, depending on option volatility levels and option liquidity, selling covered calls might be a suitable strategy, depending on your technical and fundamental assessment of a given stock. In any case, the coming weeks should provide plenty of opportunities for traders intent on establishing long equity positions in the markets. |
Donald W. Pendergast is a financial markets consultant who offers specialized services to stock brokers and high net worth individuals who seek a better bottom line for their portfolios.
| Title: | Writer, market consultant |
| Company: | Linear Trading Systems LLC |
| Jacksonville, FL 32217 | |
| Phone # for sales: | 904-239-9564 |
| E-mail address: | lineartradingsys@gmail.com |
Traders' Resource Links | |
| Linear Trading Systems LLC has not added any product or service information to TRADERS' RESOURCE. | |
Click here for more information about our publications!
Comments
Date:�06/03/09Rank:�4Comment:�

Request Information From Our Sponsors
- StockCharts.com, Inc.
- Candle Patterns
- Candlestick Charting Explained
- Intermarket Technical Analysis
- John Murphy on Chart Analysis
- John Murphy's Chart Pattern Recognition
- John Murphy's Market Message
- MurphyExplainsMarketAnalysis-Intermarket Analysis
- MurphyExplainsMarketAnalysis-Visual Analysis
- StockCharts.com
- Technical Analysis of the Financial Markets
- The Visual Investor
- VectorVest, Inc.
- Executive Premier Workshop
- One-Day Options Course
- OptionsPro
- Retirement Income Workshop
- Sure-Fire Trading Systems (VectorVest, Inc.)
- Trading as a Business Workshop
- VectorVest 7 EOD
- VectorVest 7 RealTime/IntraDay
- VectorVest AutoTester
- VectorVest Educational Services
- VectorVest OnLine
- VectorVest Options Analyzer
- VectorVest ProGraphics v6.0
- VectorVest ProTrader 7
- VectorVest RealTime Derby Tool
- VectorVest Simulator
- VectorVest Variator
- VectorVest Watchdog