HOT TOPICS LIST
- MACD
- Fibonacci
- RSI
- Gann
- ADXR
- Stochastics
- Volume
- Triangles
- Futures
- Cycles
- Volatility
- ZIGZAG
- MESA
- Retracement
- Aroon
INDICATORS LIST
LIST OF TOPICS
PRINT THIS ARTICLE
by Donald W. Pendergast, Jr.
After enduring a drop of 68% over the past year, this custom index of four commodity-linked ETFs has staged a strong reversal, suggesting that more consumer price inflation may be on the horizon.
Position: Accumulate
Donald W. Pendergast, Jr.
Donald W. Pendergast is a financial markets consultant who offers specialized services to stock brokers and high net worth individuals who seek a better bottom line for their portfolios.
PRINT THIS ARTICLE
RSI
Commodity-Linked ETF Index Suggests Consumer Inflation
06/01/09 09:19:27 AMby Donald W. Pendergast, Jr.
After enduring a drop of 68% over the past year, this custom index of four commodity-linked ETFs has staged a strong reversal, suggesting that more consumer price inflation may be on the horizon.
Position: Accumulate
| Since 2002, most traders and investors have read and/or heard a lot about the dangers of deflation and the potential for another Great Depression far worse than that of the 1930s. While it's true that home prices peaked in 2005-06 and then began to decline rapidly, followed by the stock and then commodity markets in 2007-09, it seems that the declines have all ended, with each particular asset class having made meaningful, multiyear lows along the way. Now, instead of the deflation danger, we've been made aware of the possible threat of sustained consumer price inflation, similar to that experienced in the US from the late 1960s to the early 1980s. Creating a custom index in MetaStock, I grouped together four key exchange traded funds (DBA, Powershares DB Agriculture; SLX, Market Vectors Steel Index; GDX, Market Vectors Gold Miners; and IEO, iShares US Dow Jones Oil and Gas Exploration) into one simple index, one designed to track commodity-linked stocks and tradables into one easy-to-decipher chart. The goal for this index is to not only alert me to possible trading ops in those ETFs (which track agricultural commodities and steel, gold mining and oil exploration/production stocks), but to also give me an idea of how bad the threat of future consumer price inflation is likely to be. Let's look at this particular ETF index and see what kind of information it may be sharing with us. |

|
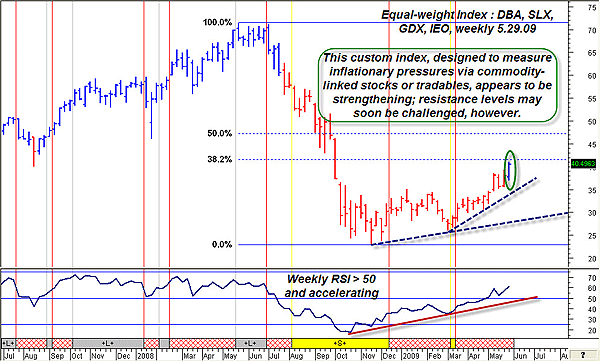
| FIGURE 1: CUSTOM INDEX, WEEKLY. After a rise of nearly 80% in just six months, is this just a simple bear market rally, or is it the beginning of the next stage in a nine-year-old commodity bull market? |
| Graphic provided by: MetaStock. |
| Graphic provided by: CS Scientific Inc. - Hybrid Trade Screen, MetaStoc. |
| |
| After constructing the index, I plotted it as a weekly chart (Figure 1) and then overlaid one of the expert advisors included with the program. Known as the CS Scientific Inc. Hybrid Trade Screen, this particular expert has done a good job in the past of identifying the start of powerful trending moves in this unique ETF index, and even better, it may be on the verge of signaling a continuation of the current bull move in DBA, SLX, GDX, and IEO. If you look at the price bars, the recent weekly bar just turned blue for the first time since July 2008, nearly a year ago. This particular MetaStock expert appears to be very reliable, even more so when the legend at the bottom of the chart prints a gray +L+ marker, indicating a confirmed bullish trend. Plot any of the four ETF's mentioned (using a weekly chart) and then overlay this particular expert, and if you see the gray +L+ print, there's an excellent chance that the trend in question will continue for several more weeks, if not longer, depending on the market. |

|
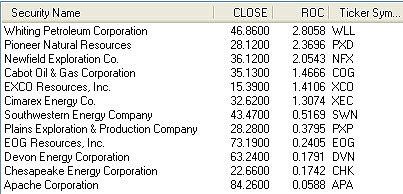
| FIGURE 2: IEO ETF. A list of the top comparative relative strength stocks in the iShares Dow Jones US Oil and Gas Exploration and Production index ETF (IEO). |
| Graphic provided by: MetaStock. |
| |
| As far as further technical confirmation, note how the uptrend lines have accelerated higher, putting the index just below the 38% Fibonacci retracement level of the massive 2008-09 downswing. Typically, a major bear market won't officially turn until after it can close above the 38% retracement level, so this would be a major confirmation that the bear market in all things commodity related has finally ended. Finally, note the strength and trend persistence of the relative strength index (RSI)(14) indicator in the lower part of the chart. Currently at 61.47, the RSI (14) is accelerating higher, right along with the index price. Students of technical analysis know that an RSI reading of greater than 50 indicates strength, so this current trend in the RSI is obviously strong and getting stronger. How to play this potential for more gains in SLX, DBA, GDX, and IEO? One way might be to sell covered calls (with four to six weeks of time value) on the strongest relative strength stocks in each particular ETF. For example, right now, the strongest component stock in IEO (the iShares Oil & Gas ETF) (Figure 2) is Whiting Petroleum (WLL), followed in descending order by PXD, NFX, COG, XCO, XEC, SWN, PXP, EOG, DVN, CHK, and APA. Each of these stocks is outperforming IEO in terms of 13-week relative strength; I suggest you investigate the liquidity, available strike prices and bid-ask spreads of the call options on these stocks to see if a covered call would be appropriate. Even more important, check out the weekly and monthly charts on each stock, attempting to locate key support/resistance levels, price zones that might help you decide on an opportune time to add a long stock or option position. |
| While all of these technical factors are important, let's face it, the mother's milk of every tradable market is liquidity, and lots of it. With the massive increases in global money supply over the past few years finally finding its way back into the stock and commodity markets, it's little wonder that commodity and stock prices have been major beneficiaries of this flood of newly created dollars. In addition, the global demand for commodities like oil, steel, agricultural products, and gold are steadily increasing, thus boosting the share prices of the companies engaged in producing such critically important, tangible goods. Fundamental forces always prove out in the end, but it always pays to focus on technical analysis tools to help time entries and exits, always attempting to stay on the right side of the longer-term fundamental forces affecting a given stock or commodity-related market. |
Donald W. Pendergast is a financial markets consultant who offers specialized services to stock brokers and high net worth individuals who seek a better bottom line for their portfolios.
| Title: | Writer, market consultant |
| Company: | Linear Trading Systems LLC |
| Jacksonville, FL 32217 | |
| Phone # for sales: | 904-239-9564 |
| E-mail address: | lineartradingsys@gmail.com |
Traders' Resource Links | |
| Linear Trading Systems LLC has not added any product or service information to TRADERS' RESOURCE. | |
Click here for more information about our publications!
Comments
Date: 06/01/09Rank: 5Comment:

Request Information From Our Sponsors
- VectorVest, Inc.
- Executive Premier Workshop
- One-Day Options Course
- OptionsPro
- Retirement Income Workshop
- Sure-Fire Trading Systems (VectorVest, Inc.)
- Trading as a Business Workshop
- VectorVest 7 EOD
- VectorVest 7 RealTime/IntraDay
- VectorVest AutoTester
- VectorVest Educational Services
- VectorVest OnLine
- VectorVest Options Analyzer
- VectorVest ProGraphics v6.0
- VectorVest ProTrader 7
- VectorVest RealTime Derby Tool
- VectorVest Simulator
- VectorVest Variator
- VectorVest Watchdog
- StockCharts.com, Inc.
- Candle Patterns
- Candlestick Charting Explained
- Intermarket Technical Analysis
- John Murphy on Chart Analysis
- John Murphy's Chart Pattern Recognition
- John Murphy's Market Message
- MurphyExplainsMarketAnalysis-Intermarket Analysis
- MurphyExplainsMarketAnalysis-Visual Analysis
- StockCharts.com
- Technical Analysis of the Financial Markets
- The Visual Investor
