HOT TOPICS LIST
- MACD
- Fibonacci
- RSI
- Gann
- ADXR
- Stochastics
- Volume
- Triangles
- Futures
- Cycles
- Volatility
- ZIGZAG
- MESA
- Retracement
- Aroon
INDICATORS LIST
LIST OF TOPICS
PRINT THIS ARTICLE
by Donald W. Pendergast, Jr.
As the regional banks industry group continues to weaken, at least one of its component stocks is on the verge of offering an attractive short sale setup.
Position: Sell
Donald W. Pendergast, Jr.
Donald W. Pendergast is a financial markets consultant who offers specialized services to stock brokers and high net worth individuals who seek a better bottom line for their portfolios.
PRINT THIS ARTICLE
ACCUM./DIST. CHAIKIN
Weak Money Flow In SIVB Creates Potential Short Setup
05/29/09 09:25:50 AMby Donald W. Pendergast, Jr.
As the regional banks industry group continues to weaken, at least one of its component stocks is on the verge of offering an attractive short sale setup.
Position: Sell
| The iShares DJ US Regional Banks Index (IAT) had a pretty good run from early March until early May 2009, but the group has fallen more than 16% since its most recent swing high of May 7, 2009. In addition, the long-term relative strength of IAT (versus the Standard & Poor's 500) is well below average, lagging the index by a significant amount. Given the likelihood of further retracements in the broad US stock indexes in the coming weeks, it makes sense to trawl through the component stocks of the regional banks index to see if there are any short trade setups taking shape. Let's look at one of IAT's most closely correlated stocks, SVB Financial Group (SIVB), seeking a potential short setup. |

|
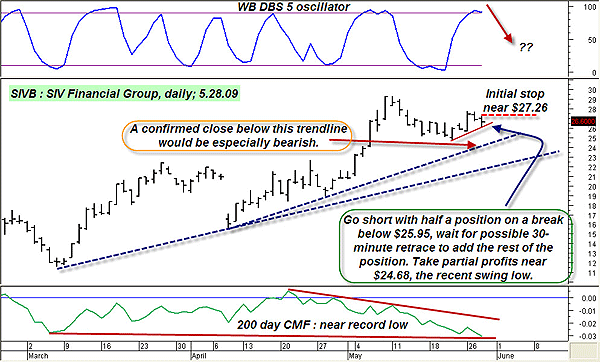
| FIGURE 1: SIVB, DAILY. Short trade entries can be tricky, but the balance of technical evidence suggests that this stock may be due for a corrective move and/or trend reversal. |
| Graphic provided by: MetaStock. |
| Graphic provided by: WB DBS5 EOD from ProfitTrader for MetaStock. |
| |
| SVB's daily chart (Figure 1) appears to need very little in the way of technical action before a decent short-sale trade setup materializes. As mentioned, the SIVB hails from the regional banking industry group, a group already manifesting both short-term and long-term relative strength versus the major US stock indexes. Next, SIVB is nearing the top of a short-term cycle high, as evinced by the WB DBS 5 oscillator (top of the chart) even as the stock has just printed a lower high. Normally, shorting stocks in an uptrend like this is risky, but look at the long-term Chaikin money flow (CMF)(200) at the bottom of the chart. Not only is the CMF near its all-time low reading and falling, but take a gander at the severity of the money flow/price divergence; even as the stock climbed up by an additional $9 during April and May, the CMF began an alarming rate of decline, warning savvy traders that the rally was soon destined to falter and/or reverse lower. Here's an idea on how to play a potential drop in SIVB over the next few sessions: On an intraday break below $25.95, put on half of a short position and then wait for some sort of a pullback higher on a 30-minute chart (watch the NYSE/NASDAQ tick and TRIN readings for temporary strength, which could also help time such an intraday pullback entry), looking for an opportune area to add the second half of the position. Once filled on all positions, place an initial stop-loss near $27.26 and then watch and wait for a potential drop down toward $24.68, which is the recent swing low. Assuming the trade goes this far south, pull half off the table for a profit and protect the balance of the position with a two-bar trailing stop of the highs. What you really want to focus on is a break below the swing low ($24.68) and/or the top blue uptrend line, preferably on a closing basis. If this occurs, this short setup could drop all the way down to the lower blue trendline, near the $23 area. Let's look at one more chart to see why SIVB's most likely trend direction, for the near term anyway, is down. |

|
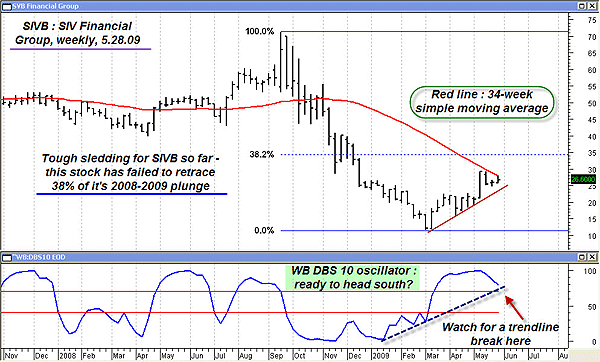
| FIGURE 2: SIVB, WEEKLY. SIV Financial Group's weekly chart trend dynamics set the pace for the daily chart trade setup. Watch for trendline breaks and/or reversals on this weekly chart to help confirm the projected path for daily swing moves. |
| Graphic provided by: MetaStock. |
| Graphic provided by: WB DBS10 EOD from ProfitTrader for MetaStock. |
| |
| Figure 2 is the weekly chart for SIVB; really, all you need to be aware of here is the topping action in the WB DBS 10 oscillator (blue line at the bottom of the chart), an excellent cyclical identification tool that appears to be on track for a break of its upper signal line and/or its uptrend line. Given that the downward-sloping 34-week simple moving average is also acting as resistance (so far), the odds of a decent move on a daily short move appear to be well above average, so long as the IAT and the broad US stock indexes also begin their long-awaited corrective move lower. Interestingly, so far SIVB has failed to even manage a full 38% retracement move of the last major weekly downtrend, a sign of continued weakness, at least until such an event occurs. |
| Short trades aren't for everybody; they tend to be more unpredictable and seem to be subject to more shakeout and fakeout moves than long trade entries. That's why it's so important to cherry-pick only the most high-probability short trades, focusing on weak stocks in weak sectors that have an overwhelming array of trend, momentum, money flow, and higher time frame dynamics working together to drive the prices of such technically impaired stocks lower. |
Donald W. Pendergast is a financial markets consultant who offers specialized services to stock brokers and high net worth individuals who seek a better bottom line for their portfolios.
| Title: | Writer, market consultant |
| Company: | Linear Trading Systems LLC |
| Jacksonville, FL 32217 | |
| Phone # for sales: | 904-239-9564 |
| E-mail address: | lineartradingsys@gmail.com |
Traders' Resource Links | |
| Linear Trading Systems LLC has not added any product or service information to TRADERS' RESOURCE. | |
Click here for more information about our publications!
Comments
Date: 05/30/09Rank: 2Comment:

Request Information From Our Sponsors
- StockCharts.com, Inc.
- Candle Patterns
- Candlestick Charting Explained
- Intermarket Technical Analysis
- John Murphy on Chart Analysis
- John Murphy's Chart Pattern Recognition
- John Murphy's Market Message
- MurphyExplainsMarketAnalysis-Intermarket Analysis
- MurphyExplainsMarketAnalysis-Visual Analysis
- StockCharts.com
- Technical Analysis of the Financial Markets
- The Visual Investor
- VectorVest, Inc.
- Executive Premier Workshop
- One-Day Options Course
- OptionsPro
- Retirement Income Workshop
- Sure-Fire Trading Systems (VectorVest, Inc.)
- Trading as a Business Workshop
- VectorVest 7 EOD
- VectorVest 7 RealTime/IntraDay
- VectorVest AutoTester
- VectorVest Educational Services
- VectorVest OnLine
- VectorVest Options Analyzer
- VectorVest ProGraphics v6.0
- VectorVest ProTrader 7
- VectorVest RealTime Derby Tool
- VectorVest Simulator
- VectorVest Variator
- VectorVest Watchdog
