HOT TOPICS LIST
- MACD
- Fibonacci
- RSI
- Gann
- ADXR
- Stochastics
- Volume
- Triangles
- Futures
- Cycles
- Volatility
- ZIGZAG
- MESA
- Retracement
- Aroon
INDICATORS LIST
LIST OF TOPICS
PRINT THIS ARTICLE
by Paolo Pezzutti
Prices are consolidating close to recent highs.
Position: N/A
Paolo Pezzutti
Author of the book "Trading the US Markets - A Comprehensive Guide to US Markets for International Traders and Investors" - Harriman House (July 2008)
PRINT THIS ARTICLE
TECHNICAL ANALYSIS
Emini S&P Toward The End Of The Rally
05/28/09 11:12:56 AMby Paolo Pezzutti
Prices are consolidating close to recent highs.
Position: N/A
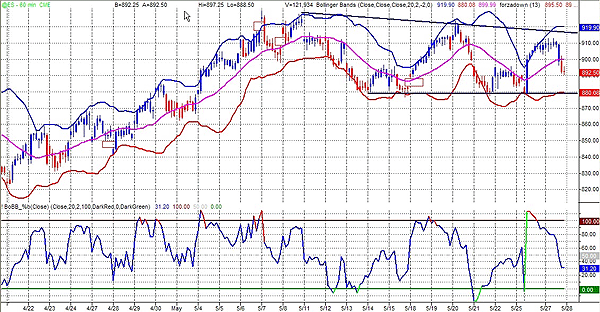
| The emini S&P reached the 927 level from the March low of 663 in about two months. It is a significant rebound with prices that managed to go back to the mid-December or beginning of January levels. Many say that this is a bear rally. Is this rally going to be another trap for bulls, or is it just the first leg of a more important move that will develop in the second part of the year? In Figure 1 (60-minute), the force index indicator, which I used to indicate the trend, is down. This indicator takes into account price and volume. A 13-bar exponential moving average (EMA) of the force index is used to track longer-term changes in the force of the market's participants. You can also see the %b indicator, which is derived from the Bollinger bands. It measures where the last price is in relation to the bands; %b is moving toward the oversold level. |
| Prices are moving sideways within a channel that was initiated two weeks ago when the emini printed a breakout to the downside of the trendline supporting the long rebound; next resistance is at 920. This level has been tested more than once already, but each time with less momentum. It is difficult to say if this level is such a resistance that will push down prices for a longer correction. The key support level is 880; you can see that prices have tested this level already four times since the beginning of May. The exit from this trading range will develop higher volatility. A lower support is at 850. See Figure 1. |

|
| FIGURE 1: EMINI S&P, 60-MINUTE. Prices are consolidating within a sideway channel. The breakout will bring higher volatility; 880 is a key support level. |
| Graphic provided by: TradeStation. |
| |
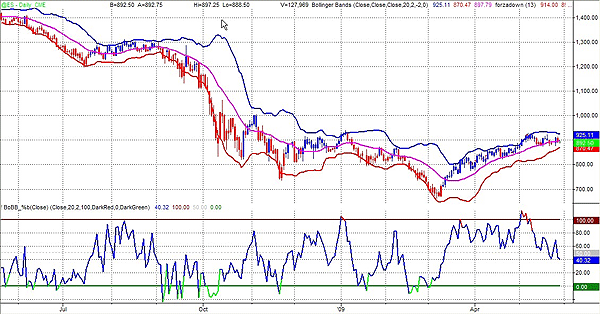
| In the daily time frame, the force index indicator does not provide any useful indication. As volatility is decreasing and prices are moving sideways, the force index is changing direction every other session. The %b indicator, after printing a negative divergence, is moving lower. You can see that the Bollinger bands are converging, indicating that the impulse to the upside is over so far and prices are consolidating in a low-volatility environment. See Figure 2. |

|
| FIGURE 2: EMINI S&P, DAILY. Prices managed to go back to the mid-December to beginning of January level. The Bollinger bands are converging and confirming the ongoing move within a trading range. |
| Graphic provided by: TradeStation. |
| |
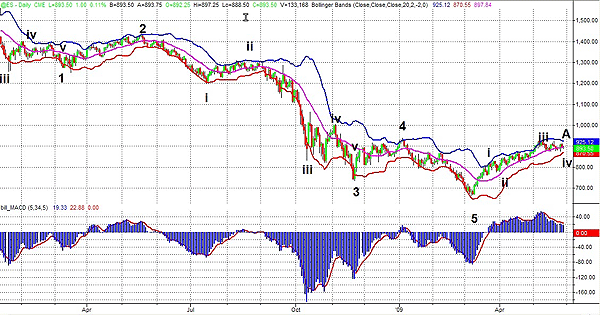
| What is interesting in this time frame is that the Elliott wave count indicates that a wave 5 has been developed to the downside ending at the beginning of March. The ongoing rebound could be part of an A-B-C correction to the primary downtrend. At the moment, according to this interpretation, the market would be in wave IV of the first up leg A; see Figure 3. Therefore, we should still expect a wave V to retest at least the 927 level. |

|
| FIGURE 3: EMINI S&P, DAILY. After five waves to the downside, the market is developing a correction in the form of an A-B-C. Prices have almost completed the first leg to the upside (wave A). We should expect soon a corrective wave B before another impulse up (wave C). |
| Graphic provided by: TradeStation. |
| |
| We are still in a downtrend. For the moment, there are no indications of a trend reversal in the longer time frame. In the short term, prices are moving sideways in a consolidation that could lead them once again to retest the high of 927. The breakout of the sideways channel will indicate the direction of prices and volatility will increase. For a short-term trade, an option is to buy weakness with prices close to the 880 support. I would not enter at the breakout to the upside because after such a long rebound, a bull trap could be likely. To open longer-term positions, I would wait for a more important correction (wave B), since we are toward the end of wave A to the upside. |
Author of the book "Trading the US Markets - A Comprehensive Guide to US Markets for International Traders and Investors" - Harriman House (July 2008)
| Address: | VIA ROBERTO AGO 26 POSTAL CODE 00166 |
| Rome, ITALY | |
| Phone # for sales: | +393357540708 |
| E-mail address: | pezzutti.paolo@tiscali.it |
Click here for more information about our publications!
Comments
Date: 05/28/09Rank: 2Comment:

Request Information From Our Sponsors
- StockCharts.com, Inc.
- Candle Patterns
- Candlestick Charting Explained
- Intermarket Technical Analysis
- John Murphy on Chart Analysis
- John Murphy's Chart Pattern Recognition
- John Murphy's Market Message
- MurphyExplainsMarketAnalysis-Intermarket Analysis
- MurphyExplainsMarketAnalysis-Visual Analysis
- StockCharts.com
- Technical Analysis of the Financial Markets
- The Visual Investor
- VectorVest, Inc.
- Executive Premier Workshop
- One-Day Options Course
- OptionsPro
- Retirement Income Workshop
- Sure-Fire Trading Systems (VectorVest, Inc.)
- Trading as a Business Workshop
- VectorVest 7 EOD
- VectorVest 7 RealTime/IntraDay
- VectorVest AutoTester
- VectorVest Educational Services
- VectorVest OnLine
- VectorVest Options Analyzer
- VectorVest ProGraphics v6.0
- VectorVest ProTrader 7
- VectorVest RealTime Derby Tool
- VectorVest Simulator
- VectorVest Variator
- VectorVest Watchdog
